ablackbu-Project-07-Composition with Curves

sketch

var points = 100;

var R = 200;
var G = 100;
var B = 100;

var depth = 3


function setup() {
    createCanvas(400, 400);
    background(0);
}


function draw() {

    //draw curves
    translate(width / 2, height / 2);
    rotate(mouseX/50);
    drawParabolaCurve();
    
    //decide color
    if(mouseX < width/2){
        R = 100;
        G = 100;
        B = 200;
    }else{
        R = 200;
        G = 100;
        B = 100;
    }
}   


function drawParabolaCurve() {
    // Parabola:
    // http://mathworld.wolfram.com/Parabola.html
    strokeWeight(0.1);
    stroke(R,G,B);
    noFill()
    
    //vertex points
    var x;
    var y;
    
    var a = 20;


    beginShape();
    for (var i = 0; i < points; i++) {
        var t = map(i, 0, points, 0, TWO_PI);
        
        //parabolic formula
        x = a * pow(t,depth) / a;
        y = 2 * a * t;
        vertex(x, y);
    }
    endShape(CLOSE);
    
}

For this project I really wanted to do/create something aesthetic. After looking through the algorithms and formulas, I found lots of them that were extremely complicated and hard to understand. I decided to go with something simple (a parabola) and influence it with both movement and color to make it look complex.

I created a formula that draws a more complex grid overtime you move your mouse. It creates a really interesting pattern and it makes the viewer want to make it more built up.

sunmink-Project07-Curves

sketch

//SunMin Kim 
//Section E
//sunmink@andrew.cmu.edu
//project-07 

// http://mathworld.wolfram.com/Epicycloid.html

function setup() {
  createCanvas(480, 480);
  frameRate(10); 
}

function draw() {
  background(139, 181, 115);
  //drawing is moving in the center 
  translate(width/2, height/2); 
 
  //draw the curve 
  drawEpitrochoid();

}

function drawEpitrochoid() {  
    var nPoints = 500; 
    strokeWeight(1);
    fill(86, 149, 204); 
    stroke(228, 213, 110);  

    var x; 
    var y;
       
    var h = constrain(mouseY, 0, 480); 
    //radius of bigger ellipse 
    var a = mouseX / 2; 
    //radius of smaller ellipse
    var b = mouseX / 400; 

   
    beginShape();
    for(var i = 0; i < nPoints; i ++){
        var t = map(i, 0, nPoints, 0, TWO_PI);
        //epitrochoid equation (x position)
        var x = (a + b) * cos(t) - h * cos (((a+ b)/b)*t); 
        //epitrochoid equation (y position)
        var y = (a + b) * sin(t) - h * sin (((a+ b)/b)*t); 
           
        vertex(x, y);
    }

    endShape();
}

For this project, after reading the sample codes, I was excited to create art using various curves. Thus I took benefit of the formula provided in Wolfram Mathworld website and created this project. Throughout this project, I struggled the most when thinking about appropriate values for each variable. I feel good with the outcome that I successfully used each variable to display what I wanted to show.

Matthew Erlebacher Project-07

Curve Pattern

// Matthew Erlebacher
// Section B
// merlebac@andrew.cmu.edu
// Project-07

function setup() {
    createCanvas(480, 480);
}

function draw() {
    background(125);

    var angR = map(mouseX, 0, 6.28318, 0, width);
    // Controls the rotation of the points
    var stem = map(mouseY, 0, 10, 0, height);
    // Determines the amount of stems
    
    push();
    translate(width/2, height/2);
    beginShape();
    for (var ang = 0; ang <= 6.28318; ang += 0.001) {
        var radius = 200 * cos(stem * ang);
        // Sets the radius
        var flowerX = radius * cos(ang);
        var flowerY = radius * sin(ang);
        // I found the equation from Dan Shiffman and decided to crank it up to 11
        // https://www.youtube.com/watch?v=f5QBExMNB1I

        strokeWeight(5);
        rotate(angR);
        point(flowerX, flowerY);
        // This creates points which create a flower pattern I used points instead of vertex because vertex looked unappealing
    }
    endShape(CLOSE);
    pop();
}

I am really glad with how this project turned out. At first I was pretty overwhelmed by the code and equations. However, after I watched Dan Shiffman’s video “Coding Challenge #55: Mathematical Rose Patterns” I had a much better understanding of the assignment. I decided that my two aspects of variability would be the amount of stems in the flower, and the rotation. I started out using vertex, but decided to change it to point since it had a much smoother look. I also wanted to make it so that it could rotate as much as possible, and have a massive amount of stems. I opted out of using color because I thought that it gave the image a more simplistic look.

Sheenu-Project-07-Composition with Curves

sketch

//Sheenu You
//Section E
//sheenuy@andrew.cmu.edu
//Project 07
var nPoints = 100;
function setup() {
    createCanvas(480, 480);
    background(0);

}
function draw(){
	background(218,205,188)
	drawLoopFlower();

}

function drawLoopFlower() { 
	//SHIFTS SHAPE INTO CENTER OF CANVAS
	translate(240,240);
	//MULTIPLIES SHAPE
	//MATH VARIABLES
	for (var o=0; o<80; o++){
	var x;
	var y;
	var a=o*.5+mouseX/5
	var b=mouseX/30;

	stroke(56+o*1,82-o*1,139-o*1);

	noFill();
	
	//STARTS SHAPE
	beginShape();
	
	//MATHEMATICAL EQUATION FOR EPIcyCLOID 
	//x=(a+b)cos(theta)-bcos((a+b)/b*theta)
	//y=(a+b)sin(theta)-bsin((a+b)/b*theta)
	//ellipse(240,240,a,a)
	
	for (var i =0; i<nPoints; i++){
		var t = map(i,0,nPoints,0, TWO_PI);
		x=(a+b)*cos(t)-b*cos(((a+b)/b)*t+80)
		y=(a+b)*sin(t)-b*sin(((a+b)/b)*t+80)
		//x=o*a*((b-1)*cos(t)+cos((b-1)*t))/b
		//y=o*a*((b-1)*sin(t)-sin((b-1)*t))/b
		vertex(x,y);
	}
	//END SHAPE
	endShape(CLOSE);
}

}

Many curve compositions posted on site inspired me to make this curve. I used a for loop to multiply the number of curves so it can create a much more visually appealing and interesting picture. I also found a color palette I liked and used it in this image. I transformed the common Hypotrochoid curve in the example into a beautiful and much more interesting shape.

Project-07

This project is an exploration of connecting two shapes through variables. My main focus was to create points along the outside of the curves, like the examples, and pass those positions to another shape as start/end points. My favorite part of this assignment was taking two existing functions, and implementing them together in one program. Some errors I encountered were duplicate variables, miscommunication of variable between functions, and misaligned positioning of drawn shapes.

sketch

//Ty Van de Zande
//ctv@andrew.cmu.edu
//Project-07
//Section B


//Most of this code was repurposed from the examples provided
//by Professor Dannenberg. Additions were made to explore 
//curves, helper functions, and passing variables.

var friz = [];
var frizy = [];
var frizX = [];
var frizyY = [];

function setup() {
    createCanvas(480, 480);
    frameRate(10);
}

function draw() {
    background(255, 200, 200); //I additionally love this pink
    fill(255, 255, 255, 64);
    var nPoints = mouseX/10;
    var radius = 50;
    var separation = 125;
    drawShape(nPoints, radius, separation);
    drawEpitrochoidCurve(nPoints);
    yoyo(nPoints, separation);

}

function drawShape(nPoints, radius, separation){  // draw the circle normally
    push();
    translate(1*separation, height / 2);
    beginShape();
    for (var i = 0; i < nPoints; i++) {
        var theta = map(i, 0, nPoints, 0, TWO_PI);
        var px = radius * cos(theta);
        var py = radius * sin(theta);
        vertex(px,py); 
        ellipse(px, py, 3,3);
        friz[i] = px;
        frizy[i] = py;
    }
    endShape(CLOSE);
    pop();  
}

//--------------------------------------------------
function drawEpitrochoidCurve(nPoints) {
    // Epicycloid:
    // http://mathworld.wolfram.com/Epicycloid.html
    
    var x;
    var y;
    
    var a = 80.0;
    var b = a / 2.0;
    var h = constrain(mouseY / 8.0, 0, b);
    var ph = mouseX / 50.0;
    
    fill(255, 200, 200);
    beginShape();
    for (var i = 0; i < nPoints; i++) {
        var t = map(i, 0, nPoints, 0, TWO_PI);
        
        x = (a + b) * cos(t) - h * cos(ph + t * (a + b) / b);
        y = (a + b) * sin(t) - h * sin(ph + t * (a + b) / b);
        vertex(x+height/2, y+width/2);
        frizX[i] = x;
        frizyY[i] = y;
        
        
    }
    endShape(CLOSE);
    
}

function yoyo(nPoints, separation) {
    var w = width/2;
    for(var i = 0; i < nPoints; i++) {
        line(friz[i]+separation, frizy[i]+w, frizX[i]+w, frizyY[i]+w);
    }
    
}

yunzhous-project-07

sketch

function setup() {
    createCanvas(480, 480);
    angleMode(DEGREES);
}

function draw() {
    background("lightcyan");
    curve1();
    curve2();
}

function curve1(){
    //astroid
    beginShape();
    stroke(178, 240, 241);
    noFill();
    translate(width/2, height/2);
    for (var i = 0; i < mouseX/2; i ++){ //mouseX controls number of curves
        LimMouseX = constrain(mouseX, 0, width);
        var a = map(LimMouseX, 0, width, 10, 80); //relate to mouseX
        var theta = map(i, 0, mouseX, 20, 360);
        var x = 2 * a * cos(theta) + a * cos(2 * theta);
        var y = 2 * a * sin(theta) - a * sin(2 * theta);
        vertex(x, y);
    endShape();
    rotate(mouseX); //rotate according to position of mouseX

    }
}
function curve2(){

    //Epicycloid Involute
    beginShape();
    stroke(178, 230, 241);
    noFill();
    for (var i = 0; i < mouseX; i ++){ //mouseX controls number of curves
        LimMouseX = constrain(mouseX, 0, width);
        var a = map(LimMouseX, 0, width, 0, 80); //relate to mouseX
        var theta = map(i, 0, mouseX/5, 20, 360);
        var b = map(mouseY, 0, height, 0, 50);
        var x2 = (a+b)*cos(theta) - b*cos(((a+b)/b)*theta);
        var y2 = (a+b)*sin(theta) - b*sin(((a+b)/b)*theta);
        vertex(x2, y2);
    endShape();
    }
}

For this project, I started with researching for curves. I found astroid and epicycloid involute to be interesting and not overly complicated. I wrote two for loops to create multiple curves, and the curves rotate to create repetition. The curves are centered at the canvas and as mouseX and mouseY moves, they generate different pattern


rsp1-Project-07-Curves

sketch

/*Rachel Park
rsp1@andrew.cmu.edu
Section B @ 10:30AM
Project 07: Composition with Curves*/


function setup() {
  createCanvas(480, 480);
}

function draw() {
  background(240);
  translate (width/2,height/2);
  noStroke();
  stroke(100);
  noFill();
  drawHypotrocloid();
}

function drawHypotrocloid() {;

    //initializing the x and y variables
    var x;
    var y;

    //setting the variables for the hypotrocloid equation
    var a = 200;
    var h = map(mouseX, 0,width, 0, 480);
    var b = a/map(mouseY, 0, height, 0, 480);

    //drawing the hypotrocloid
    beginShape();
        for (var i = 0; i < 550; i++) {

            var angle = map(i, 0, 550, 0, TWO_PI);

            var x = (a - b) * cos(angle) + h * cos (((a - b)/b)*angle);
            var y = (a - b) * sin(angle) - h * sin (((a - b)/b)*angle);

            vertex(x, y);

        }
    endShape();
}

For this project I decided to use the hypotrocloid.

Like the screencaps of my code below, I found that I could generate very interesting shapes and patterns just from the one type of curve, and had fun moving around the mouse to try out different configurations.


These screencaps of my code above represent the patterns generated as the mouse if moved from the left to the right side of the canvas.

These following screencaps represent the patterns generated as the mouse is moved from the top to the bottom of the canvas.


mjanco – Project07 – Curves

sketch

//Michelle Janco
//Section B
//mjanco@andrew.cmu.edu
//Project-07

var gPoints = 100;
var EPITROCHOID = 0;
var curveMode = EPITROCHOID;

function setup() {
    createCanvas(400, 400);
    frameRate(20);
}

function draw() {
    background(255, 155, 100);

    // draw curve
    push();
    translate(width / 2, height / 2);
    switch (curveMode) {
    case EPITROCHOID:
        drawEpitrochoidCurve();
        break;
    }
    pop();
}

function drawEpitrochoidCurve() {
    // http://mathworld.wolfram.com/Epicycloid.html

    var x;
    var y;

    var a = 80.0;
    var b = a / 10.0;
    var h = constrain(mouseY / 20.0, 0, a);
    var ph = mouseX / 50.0;

    fill(200, 240, 200);
    beginShape();
    for (var i = 0; i < gPoints; i++) {
        var t = map(i, 10, gPoints, a, TWO_PI);

        x = (a + b) * cos(t) - h * cos(ph + t * (a + b) / b);
        y = (a + b) * sin(t) - h * sin(ph + t * (a + b) / b);
        vertex(x-10, y+10);
    }
    endShape(CLOSE);

    fill(150, 250, 0,100);
    beginShape();
    for (var i = 0; i < gPoints; i++) {
        var t = map(i, 10, gPoints, a, TWO_PI);

        x = (a + b) * cos(t) - h * cos(ph + t * (a + b) / b);
        y = (a + b) * sin(t) - h * sin(ph + t * (a + b) / b);
        vertex(x+10, y-10);
    }
    endShape(CLOSE);

}

For this project, I played around a lot with the values of my variables, as well as values in the mapping function of my for loops. Once I found a visual I liked, I knew I wanted to duplicate the pattern, offset it a bit, and change the alpha value to create some new colors where the curves overlap.

aboyle-Project 07-Curves

aboyle curves

//Anna Boyle
//Section D
//aboyle@andrew.cmu.edu
//Project 07 Curves

function setup() {
    createCanvas(480,480);
}

function draw() {
    background(38,48,97)
    //draws all the stars/moons
    //Placement and size deliberately chosen by me
    push();
    translate(width/2, height/2-30);
    drawHypotrochoid()
    pop();
    push();
    translate(50,100);
    scale(0.2,0.2);
    drawHypotrochoid();
    pop();
    push();
    translate(400,50);
    scale(0.15,0.15);
    drawHypotrochoid();
    pop();
    push();
    translate(220,40);
    scale(0.1,0.1);
    drawHypotrochoid();
    pop();
    push();
    translate(100,350);
    scale(0.25,0.25);
    drawHypotrochoid();
    pop();
    push();
    translate(30,240);
    scale(0.1,0.1);
    drawHypotrochoid();
    pop();
    push();
    translate(420,400);
    scale(0.2,0.2);
    drawHypotrochoid();
    pop();
    push();
    translate(360,340);
    scale(0.1,0.1);
    drawHypotrochoid();
    pop();
    push();
    translate(410,180);
    scale(0.17,0.17);
    drawHypotrochoid();
    pop();
    push();
    translate(50,430);
    scale(0.1,0.1);
    drawHypotrochoid();
    pop();
    fill(255)
    //text to show how many sides there are
    textSize(20)
    text("SIDES:",15,30)
    text(sides,85,30)
    textSize(30)
    //"Goodnight, moons" when circles
    //"Goodnight, stars" when star-shaped
    if (mouseY<100){
        celestial="moons"
  } if (mouseY>380){
        celestial="stars"
  } if (mouseY>=100 & mouseY<=380){
        celestial="."
        fill(38,48,97)
  }
    text ("Goodnight, ", 130, 410)
    text(celestial,285,410)

}

//how many sides there are
var sides=4

function drawHypotrochoid(){
    var x;
    var y;
    //makes the shapes bigger or smaller
    var a=constrain(mouseX/4, 40, 130);
    var b=a/sides
    var h=constrain(mouseY/16, 0, b)
    var ph=mouseX/50
    var nPoints=100
    noStroke()
    fill(243,250,142)
    //the equation for the curve
    beginShape();
        for (var i=0; i<nPoints; i++){
        var t=map(i, 0, nPoints,0,TWO_PI);
        x = (a-b) * cos(t) + h * cos(ph + t*(a-b)/b);
        y = (a-b) * sin(t) - h * sin(ph + t*(a-b)/b);
           vertex(x,y)
    }
    endShape(CLOSE);
}

//If mouse is pressed, another side is added
//stays between 4 and 8 sides
function mousePressed(){
    sides=sides+1
      if (sides>8){
          sides=4
  }
}

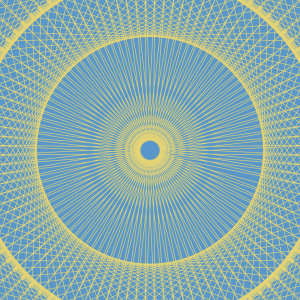
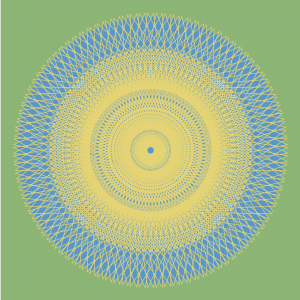
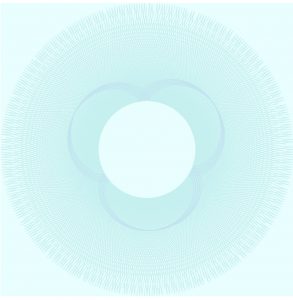
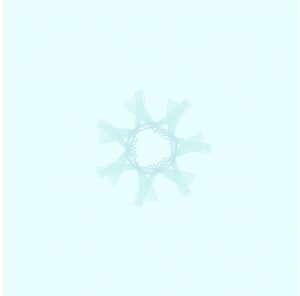
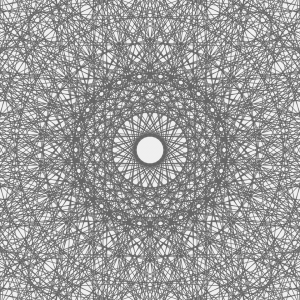
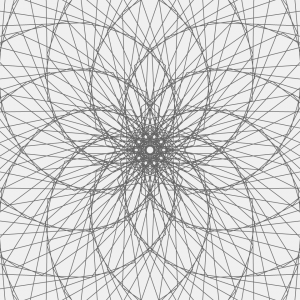
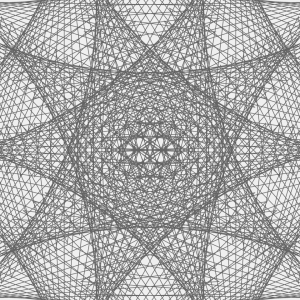
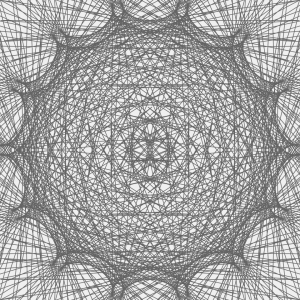
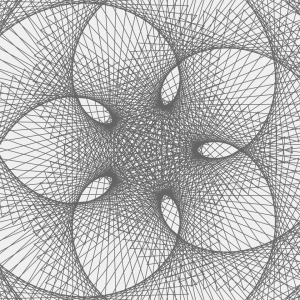
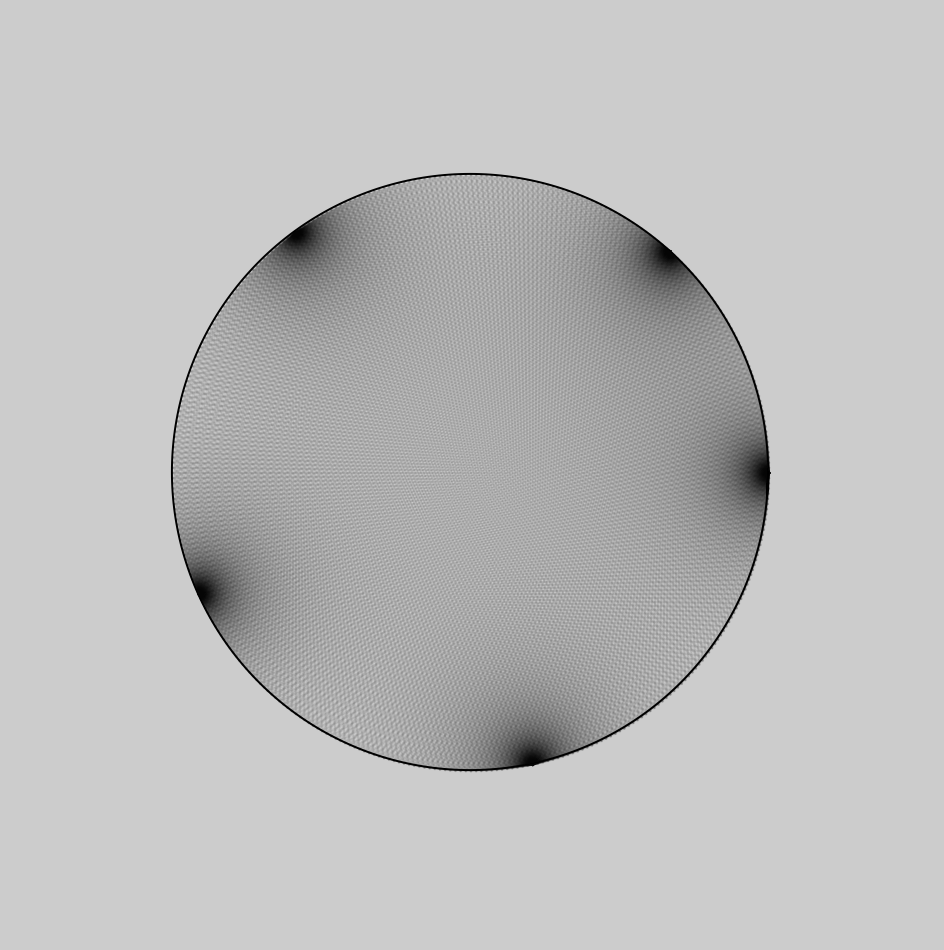
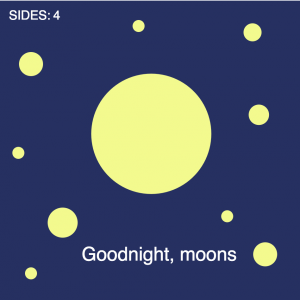
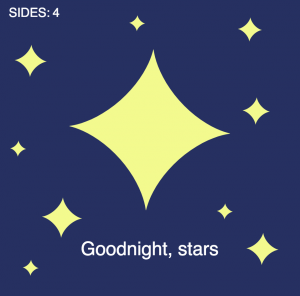
For the type of curve, I selected hypotrochoid. (http://mathworld.wolfram.com/Hypotrochoid.html). Since it was fairly similar to epitrochoid curves, I referenced the example while I was writing my code. I had some trouble making it look like what I wanted it to; for a while, it was only a circle that got thinner or wider as you moved the mouse. Eventually I figured out that the number you divide variable a by is the number of sides. When I increased that number, it looked a lot more like the example image given on mathworld.wolfram.com. I made it so the curve starts with four sides, but you can add up to eight by clicking the mouse.  You can make the curve bigger or smaller by moving the mouse from left to right or vice versa.

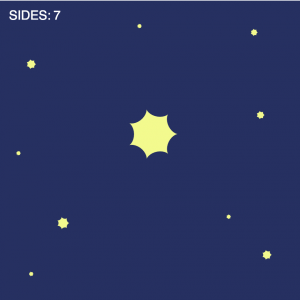
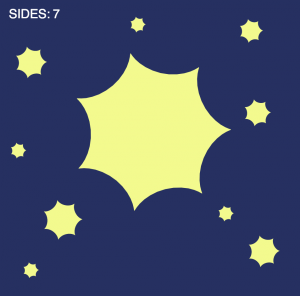
Somewhere along the line I realized that the two extremes were a circle and a star shape, so I made it a sky full of celestial objects and I added the text “Goodnight, moons” and “Goodnight, stars” when the mouse was at the top and the bottom.

I wish I had done more to experiment visually, but overall I enjoyed this project!

svitoora – 07 – Squircle

sketch

// 
// Supawat Vitoorapakorn
// Svitoora@andrew.cmu.edu
// Section E
// 
// Squircle
// Equation from:
// https://en.wikipedia.org/wiki/Superellipse

w = 480;
h = 480;

//Signum function
function sgn(x) {
	if (x > 0) {
		return 1
	}
	if (x == 0) {
		return 0
	}
	if (x < 1) {
		return -1
	}
}

//------------------------

var SQUIRCLE = []; // Array for nodes
var theta;
var a = w * .33 // Squircle width
var b = h * .33 // Squircle height
var n = 3.5 // roundness

// Create nodes for squircle
function create_squircle(x, y) {
	this.x = x;
	this.y = y;
}

// Calculate Squircle's X position from theta
function squircle_x() {
	angleMode(DEGREES);
	return abs(cos(theta)) ** (2 / n) * a * sgn(cos(theta))
}

// Calculate Squircle's Y position rom theta
function squircle_y() {
	angleMode(DEGREES);
	return abs(sin(theta)) ** (2 / n) * b * sgn(sin(theta))
}

// Create Squircle based on an interval of theta
// and push its node into an array
function make_squircle() {
	angleMode(DEGREES);
	//Plot every interval degree of squircle
	interval = 1;
	for (theta = 0; theta < 360; theta += interval) {
		x = squircle_x(theta);
		y = squircle_y(theta);
		SQUIRCLE.push(new create_squircle(x, y))
	}
}

var gon = 60;
var min_gon = 45;
var max_gon = 160;
var SWITCH = 1;
// Create a bounce loop animation from drawing lines
function gon_loop() {
	print(SQUIRCLE.length)
	if (gon == max_gon) {
		SWITCH = -1;
		print("inversing");
	};
	if (gon == min_gon) {
		SWITCH = 1;
	}
	gon += SWITCH;
}

// Draws Squircle from array
function draw_squircle() {
	//Draw Shape

	if (inverse == 1) {
		fill(255);
	} else {
		fill(0);
	}
	beginShape();

	strokeWeight(1);
	for (i in SQUIRCLE) {
		x = SQUIRCLE[i].x
		y = SQUIRCLE[i].y
		curveVertex(x, y);
	}
	//Force Close Shape
	curveVertex(SQUIRCLE[5].x, SQUIRCLE[5].y);
	endShape(CLOSE);
	connect_lines();
}

// Connect a point in squircle to every point
function connect_lines() {
	//Add lines
	if (inverse == 1) {
		stroke(0, 0, 0, 255 * .1);
	} else {
		stroke(255, 255, 255, 255 * .1)
	}
	for (i in SQUIRCLE) {
		x_0 = SQUIRCLE[i].x
		y_0 = SQUIRCLE[i].y
		for (i in SQUIRCLE) {
			if (i % (gon) == 0) {
				// %gon used to skip certains nodes
				// to not overload the computer
				x_1 = SQUIRCLE[i].x
				y_1 = SQUIRCLE[i].y
				line(x_0, y_0, x_1, y_1);
			}
		}
	}
}

//------------------------

function setup() {
	createCanvas(w, h);
	background(255 * .75);
	make_squircle();
	print(SQUIRCLE.length / 2, SQUIRCLE.length / 6)
}

//------------------------

// Use mouseX to control the roundeness of squircle
function control_roundness() {
	mousePos = (abs(mouseX - (w / 2)) / (w / 2));
	mousePos = constrain(mousePos, 0, 1);
	roundness = map(mousePos, 0, 1, .2, 10);
	n = roundness;
	SQUIRCLE.length = 0;
	make_squircle();
}

//Use mouseY to control size of squircle
function control_size() {
	mousePos = (abs(mouseY - (h / 2)) / (h / 2));
	mousePos = constrain(mousePos, 0, 1);
	size = map(mousePos, 0, 1.2, .175, .35);
	a = w * size;
	b = h * size;
	SQUIRCLE.length = 0;
	make_squircle();
}

function mouseClicked() {
	inverse = inverse * -1;
}

//------------------------

var inverse = 1; // incerts color
function draw() {
	if (inverse == 1) {
		background(255 * .8);
	} else {
		background(255 * .1)
	}
	control_roundness();
	control_size();
	gon_loop(); //bounce animation for connecting line

	//Draw Closed Shape
	push()
	translate((w / 2), (h / 2)) // center drawing
	draw_squircle();
	pop()
}

Squircle

For my equation, I picked the superellipse equation which is capable of creating a squircle. I stumbled upon this equation on MathWorld:

\left|{\frac {x}{a}}\right|^{n}\!+\left|{\frac {y}{b}}\right|^{n}\!=1,

Since this equation is not particularly helpful, I went on Wikipedia and found the parametric equation for the superellipse:

{\displaystyle {\begin{aligned}x\left(t\right)&={|\cos t|}^{\frac {2}{m}}\cdot a\operatorname {sgn}(\cos t)\\y\left(t\right)&={|\sin t|}^{\frac {2}{n}}\cdot b\operatorname {sgn}(\sin t)\end{aligned}}}

At first, I was a bit confused about what the signum sgn() function is, but after some googling, I understood it and was able to replicate the function easily in javascript. Initially, I thought about  doing a spirograph whereby a pen would rotate around the moving point and generate a drawing with variable orbital roundness:

Initial Idea sketched on Desmos.

Variable Density

After re-building my equation in javascript, I found that the curve was denser in some area than others. This I believe is caused by the way that I parametrically constructed this curve via iterating from 0 to 360˚ and pushing the nodes into an array:

Notice how the nodes are denser near the corners.

Had this been constructed through Calculus, these variable densities wouldn’t occur. But since these variable densities existed, I decided to take advantage of it use it as nodes to do a string art. These are the results: