atraylor – Project 07 – Section B

sketch

// atraylor@andrew.cmu.edu
//Project 07
// Section B


var a = 0;


function setup() {
    createCanvas(400, 480);
    noStroke();
}

function draw() {
    background(171, 163, 247);
    scribble();
}

function scribble(i, a, rad2, x, y) { // make the curve
    a = map(mouseX, 0, width, 10, 110); // number of lines in curve by mouse position
    var rad2 = 40; // staring radius

    beginShape();
    fill(203, 90, 243, 10);
    stroke(151, 227, 245);
    translate(width/2, height/2); //center
    for(var i = 0; i < a; i++) {
        var theta = map(i, 0, a/80, 0, TWO_PI); // apply values of i to radians in circle
        var x = rad2 * cos(theta); // x position of vertex
        var y = rad2 * sin(theta); // y position of vertex
        vertex(x, y);
        rad2 *= 1.02; // this makes it a spiral rather than a circle.
    endShape();
    }
}

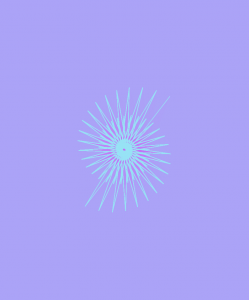
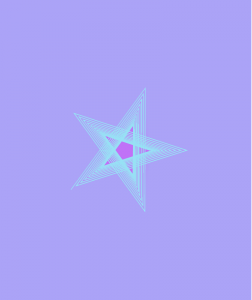
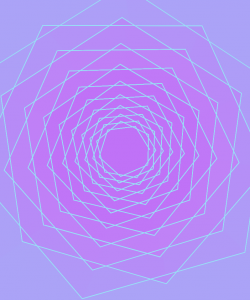
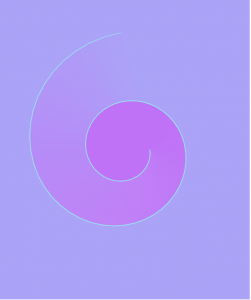
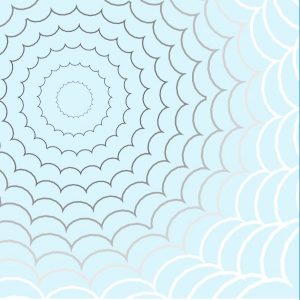
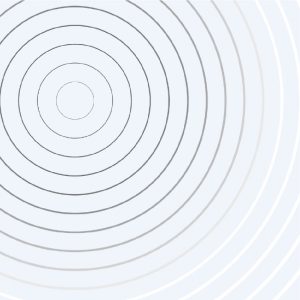
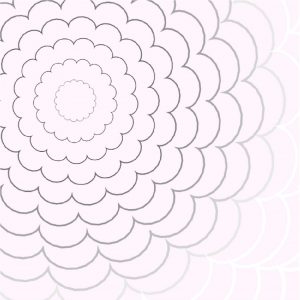
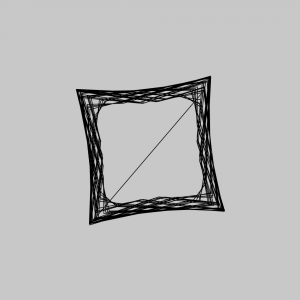
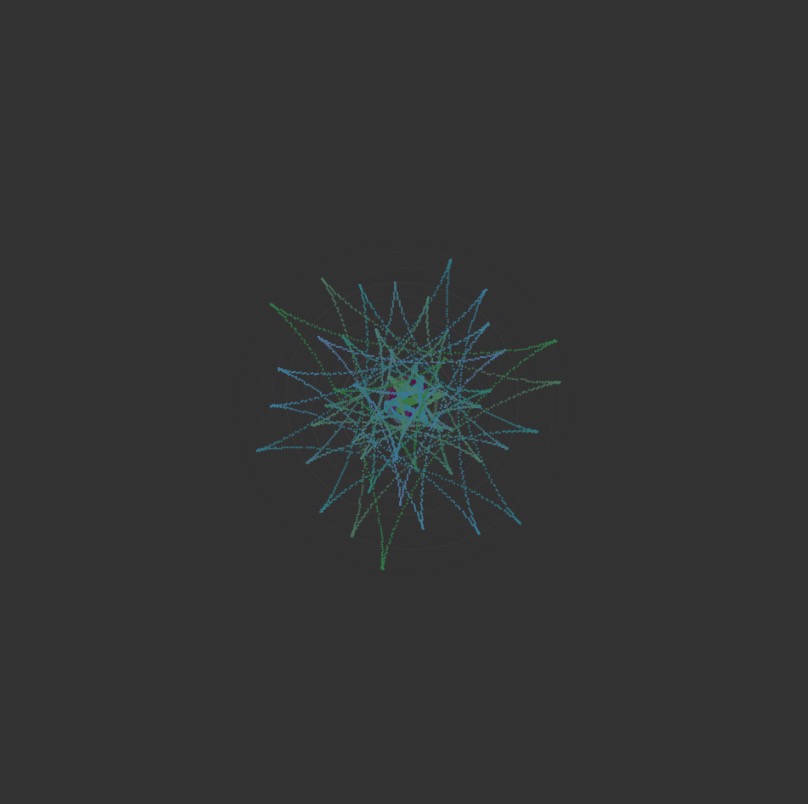
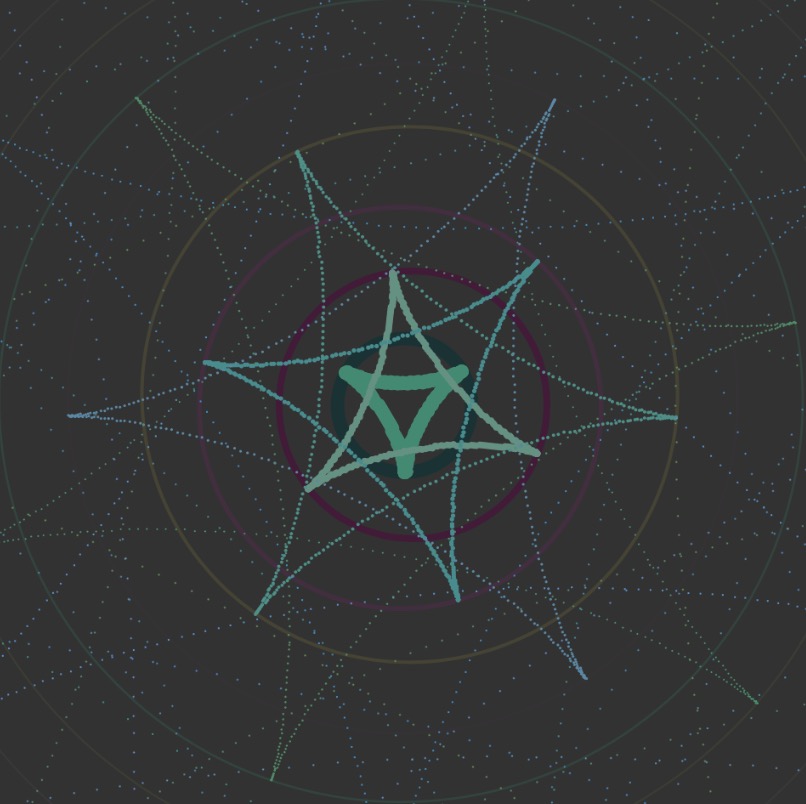
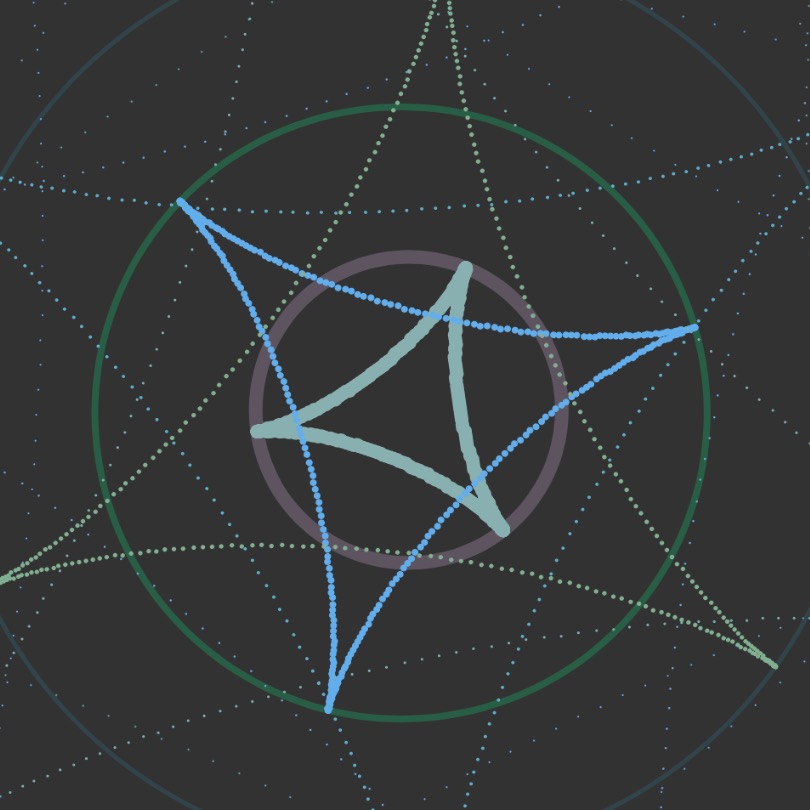
For this project I used a parametric version of the logarithmic spiral to draw my curves. I played with it so the function would draw various shapes rather than simply growing a spiral when segments were added. There are several areas where you can see the near perfect spiral, and others where it’s simply a mess of lines. Its interesting to see the shapes that are spirals but have clear sides so they form stars, triangles, or pentagons. I added a fill to the curve with an alpha channel to emphasize the growth and change of the shape.

Jihee Kim_SectionD_Project-07-Curves

jiheek1_project7

//Jihee Kim
//15-104 MWF 9:30
//jiheek1@andrew.cmu.edu
//Project 7 Curves
//section D

var backgroundRed;// Red value of background
var backgroundGreen = 245; // Green value of background
var backgroundBlue = 252;// Blue value of backgound

function setup() {
    createCanvas(480, 480);

}


function draw(){
    background(backgroundRed, backgroundGreen, backgroundBlue);
    //The background color changes from light blue to light pink
    //when mouseY moves from top to bottom of canvas
    backgroundRed = map(mouseY, 0, height, 219, 255); //R value changes

    push();
    translate(width/4, height/3); //push over the generating point of curves
    for (var i = 1; i < 16; i++) { //loop from first to sixteenth value
        //show depth through color and lineweight
        stroke(map(i, 1, 5, 30, 120)); //the stroke turns from grey to lighter
                                       //grey as the curve moves away from
                                       //the focal point of curves
        strokeWeight(map(i, 1, 5, 0.3, 2)); //strokeWeight increases as curves
                                            //get further away from focal point
        //call the drawCurve function to draw curves
        drawCurve(i*2); //use 'i' as scale factor for spacing between curves
        rotate(PI/3); //rotate each time a curve is drawn
    }
    pop();
}


function drawCurve(scaleF) { //using 'i' as the scale factor (scaleF)
    var a = 15;
    var b = (map(mouseX, 0, width, -1, 1)); //the curves form a hypocycloid
                                            //when b(radius of rolling circle)
                                            //is negative, and a epicycloid
                                            //when the value is positive
    noFill();
    //start shape
    beginShape();

    for (var i = 0; i < 200; i++) { //a bigger max gives you a smoother curve
        var t = map(i, 0, 200, 0, 2*PI); //map 't' so that it only rotates
                                         //full circle once (2PI)
        var x = (a + b) * cos(t) - b * cos((a/b + 1) * t);
        var y = (a + b) * sin(t) - b * sin((a/b + 1) * t);
        vertex(scaleF*x, scaleF*y);
    }
    //end shape
    endShape(CLOSE); //this caps the beginning and the end
}

For this project, I created an interactive set of curves that were generated though a mathematical equation. I made it so that the shape that the curves form morphs from a hypocycloid to an epicycloid (left to right) depending on the position of the mouse.

Some other aspects that I manipulated so that the main theme, which is depth, is clear are lineweights, color, and spacing. Using for loops and mapping, I made it so that the stroke turns from grey to a lighter color on the greyscale as the curves move away from the focal point of curves. Moreover, the lineweight of these curves also increases as the curves get further away from the focal point.

hypocycloid (clouds)
curves (midway)
epicycloid (flower)

The curves are supposed to look like a sky full of clouds when they are forming a hypocycloid, and a flower when they are forming a epicycloid. The background color varies with the y position of the mouse, adding to the intention behind incorporating both cyclodal curves, as well.

math equation source

Project-07 Composition with Curves

//Yoonseo(Dave) Choi
//Section B
//yoonseo1@andrew.cmu.edu
//Project 07
var npoints =100; //points for generating curve
function setup() {
    createCanvas(480,480); //canvas size of 480 by 480
    angleMode(DEGREES); //set radian to degree

}

function draw() {
    background(0);//set background to black
    stroke(255); //curve colro tobe white 
    var mx = constrain(mouseX,30,width-30); // return mousex value within constrain
    var my = constrain(mouseY,30,height-30); //return mousey value within constrain
    noFill(); //no fill on geometry
    heart(mx,my); // execute heart function wiggly heart
    heart2(mx,my); //execute heart2 function line following mouse
    nails(mx,my);
}
function heart(rn1,rn2){ //for getting parameter for x,y mouse 
    strokeWeight(0.5); //set stroke size to 0.5
    push() 
    beginShape();
    translate(width/2,height/2) // make it center at middle 
    for (var i =0; i <npoints;i++) { // for loop for creating geometry
    var t = map (i,0,npoints,0,360); // map t value to degree
    var x = 16*sin(t)*sin(t)*sin(t); // x function from the mathworld wolf cam
    var y = 13*cos(t)-5*cos(2*t)-2*cos(3*t)-cos(4*t); //y function from mathworld wolf cam 
    vertex(x*rn1/40+(rn1/50*random(-0.5,0.5)),-y*rn2/40+(rn2/50*random(-0.5,0.5))); //create heart shape with wiggle 
    //as mouse move wiggle gets small or big
    }
    endShape(CLOSE); //end the geomtry
    pop();
}
function heart2(rn1,rn2){
    strokeWeight(0.5);//set stroke size to 0.5
    push();
    
    for (var i =0; i <npoints;i++) { // for generating geometry
    var t = map (i,0,npoints,0,360); // t value to degree
    var c = color (150,0,0); // color to red 
    stroke(c); // set stroke color to red
    var x = 16*sin(t)*sin(t)*sin(t); // heart x
    var y = 13*cos(t)-5*cos(2*t)-2*cos(3*t)-cos(4*t);//heart y 
    line(rn1,rn2,x*rn1/60+width/2,-y*rn2/60+height/2); //create line from heart to mouse position
}
    pop();
}
function nails(rn1,rn2){
    stroke(255,81,51,500-(rn1+rn2)/2) //color alpha change based on the mosue
    strokeWeight(0.4);  //stroke weight 

    push(); 
    beginShape();
    translate(width/2,height/2);
    for (var i =0; i <npoints; i++){
    var t = map (i,0,npoints,0,360); //mapping to dgrees 
    var r = map((rn2+rn1),0,(height+width),0,100); // mapping radius to max 100 based on mouse
    var x = r*cos(t); // circle x
    var y = r*sin(t); //circle y 
    vertex(x*rn1/200,y*rn2/200);//outer line for the vertex
    vertex(x*rn1/150,y*rn2/150);//inner circle for connecting 
  }
    endShape(CLOSE); //close the geometry 
    pop();
}

While I was searching for which curve to play with, I found heart shaped curve. I wanted to express emotion that I was having when the idea came up. I wanted the heart to give unstable look with directional element. At the same time, I look for other curve that could be used to show nail. I wanted to illustrate nails in the heart when heart is small but as it grow, nail starts to disappear. I have used r cos(theta) and r sin(theta) to generate the circular curve that will be used to represent the nail. To show the instability of the heart I used the wiggling motion, and I have used line to move along with the mouse coordinate to show dynamic direction that heart can point to.

alchan-Project 07-curves

curves

// attributes of shape
var points;
var angle;

function setup() {
  createCanvas(480, 480);
  angleMode(DEGREES);
  frameRate(30);
}

function draw() {
  background(200);
  // set attributes to change with mouse position
  points = map(mouseX, 0, width, 0, 300);
  angle = map((mouseX + mouseY / 2), 0, width, 0, 360);
  // draw "main" curve
  stroke(209, 122, 110);
  drawCurve(width/2, height/2);

  // draw "background" curves, setting each to a random color
  // and a randomized position
  stroke(random(200, 255), random(200, 255), random(200, 255));
  drawCurve(width/2 + random(-10, 10), height/2 + random(-10, 10));
  stroke(random(200, 255), random(200, 255), random(200, 255));
  drawCurve(width/2 + random(-20, 20), height/2 + random(-20, 20));
  stroke(random(200, 255), random(200, 255), random(200, 255));
  drawCurve(width/2 + random(-30, 30), height/2 + random(-30, 30));
  stroke(random(200, 255), random(200, 255), random(200, 255));
  drawCurve(width/2 + random(-40, 40), height/2 + random(-40, 40));
}

function drawCurve(posX, posY) {
  var x;
  var y;
  //var a = 400;
  var b = map(mouseY, 0, 480, 20, 80);

  strokeWeight(1);
  noFill();

  push();
  translate(posX, posY);
  rotate(angle);
  // astroid curve (http://mathworld.wolfram.com/Astroid.html)t
  beginShape();
  for (var i = 0; i < points; i++) {
    x = 3 * b * cos(i) + b * cos(3* i);
    y = 3 * b * sin(i) - b * sin(3 * i);
    vertex(x + random(0,2), y + random(0,2));
  }
  endShape(CLOSE);
  pop();
}

Since I was a little overwhelmed with the idea of creating a project based on mathematical curves, I decided to approach the project by “sketching” in the browser and figuring out how the code/ curve would render as I modified different variables. I chose an astroid for my curve. I also hadn’t originally set the angle mode of the drawing to degrees, and ended up with a spirograph-like drawing at first which was visually interesting, but not quite what I was going for.

Once I had figured out how to make the curve actually a curve, I added in variables to make the size, number of points drawn, and rotation of the curve interactive. I also added elements of randomization to try to achieve a flickering/ glitching effect to add more interest.

mecha-project07-curves

sketch

//maddy cha
//section e
//mecha@andrew.cmu.edu

var nPoints = 100;

function setup() {
    createCanvas(480,480);
}

function draw() {
    //background g value is increased with mouseX
    background(255,constrain(map(mouseX,0,width,0,255),210,240),200);   
    frame();
    //location of curve depends on mouse (but is constrained 60 pixels around center in x and y directions)
    translate(constrain(mouseX,width/2-30,width/2+30),constrain(mouseY,height/2-30,height/2+30));
    hypocycloid();
}

//draws outside black rectangle
function frame(){
    noFill();
    stroke(0);
    rect(0,0,width-1,height-1);
}

function hypocycloid(){
    var x;
    var y;
    var r;
    var a = map(mouseX,0,width,0,150);
    //increases amount of points on hypocycloid
    //makes it so that points are increasing by whole numbers
    var b = nf(map(mouseX,0,width,0,6),2,0);

    push();
    //rotates based on mouseX location
    rotate(mouseX);
    //opacity of shape is dependant on mouseX
    fill(256,256,256,map(mouseX,0,width,0,100));
    beginShape();
    for (var i = 0; i < nPoints; i++) {
        var t = map(i, 0, nPoints, 0, TWO_PI);
        
        x = (a/b)*((b-1)*cos(t)-cos((b-1)*t))
        y = (a/b)*((b-1)*sin(t)+sin((b-1)*t));
        //draws points at x and y values (with some randomness)
        //nPoints dictates how many points are drawn between lines
        vertex(x+random(-2,2), y+random(-2,2));
    }
    endShape(CLOSE);
    pop();
}

For this project, I started with creating a deltoid by implementing the formula into my code. Once I was able to understand how to do this, I wanted to expand my scope by looking at the overarching hypocycloid. I decided that I wanted my mouseX and mouseY interactions to increase the amount of cusps that would appear on my shape. In order to do this, I had to alter my original deltoid formula to take in a greater amount of variables.

Once I figured that out, I implemented more ways in which the user could interact with my code using their mouse. I relied on the constrain() and map() functions in order to make sure the shape stayed in the canvas. While mouseY was used to change the location of my shape, mouseX dictated the amount of cusps, the color of the background color, the size, fill opacity, and the rotation of the hypocycloid. Additionally I experimented with adding randomness so that my project would be more visually entertaining.

jiaxinw-Project-07-Curves

sketch

var mouse_x;

function setup() {
    createCanvas(480, 480);
}

function draw() {
    background(50);
    var x;
    var y;

    // limit the mouseX only works in canvas
    if(mouseX<width & mouseX >0){
        mouse_x = mouseX;
    } else if (mouseX<=0){
        mouse_x = 0;
    } else{
        mouse_x = width;
    }

    // http://mathworld.wolfram.com/Deltoid.html 
    // mapping the b from 0 to 480 into from 0 to 30,
    // and since b is the radius of the small circle, make it relate to
    //mouse X can change the scale of the curves. 
    var b = map(mouse_x, 0, width, 0, 30);

    for (var i = 1; i <= 20; i++) {
        push();
        //put the whole thing in the center of the canvas and make it shake
        translate(width/2+random(-5,5), height/2+random(-5,5));
        //change mouseX also affect the rotation of the shapes 
        var rotateAng = map(mouse_x, 0, width, 0, TWO_PI)
        //make the rotation more obvious
        rotate(rotateAng + i*3);
        //make the stroke weight become less according to the number of shape
        strokeWeight(8/i);
        noFill();
        //make the stroke color of circles randomlmy change
        stroke(random(20,100),random(10,130),random(50,100)
            ,400/i);
        ellipse(0,0,6*i*b,6*i*b);
        //call the function to draw curves
        DrawCurves(i * b);
        pop();
    }
}

function DrawCurves(R) {
    //map the color change into a range as the mouseX is changing
    var red = map(mouse_x, 0, width, 10, 20);
    var green = map(mouse_x, 0, width, 10, 15);
    var blue = map(mouse_x, 0, width, 10, 20);

    fill(red*random(4, 7), green*random(11,12),blue*random(6,15));
    //draw curves according to the parametric equations
    for (var i = 0; i < 360; i++) {
        var t = radians(i);
        x = 2 * R * cos(t) + R * cos(2 * t);
        y = 2 * R * sin(t) - R * sin(2 * t);
        beginShape(POINTS);
        vertex(x, y);
        endShape();
    }
}

First, I went through the curves and picked out Deltoid (http://mathworld.wolfram.com/Deltoid.html) one to play around.

After I successfully drew our the curve in a static way, I thought about how to make it look more interesting. I tried to draw multiple curves in different scales but found that if they are in the same direction, it looked boring. So I tried to make them rotate and point to different directions. Next step, I used mouseX to control the rotation. And I thought if the scale of the curves can also be changed, it would be interesting! After this was done, I figured out I could also play around with the stroke weight to make curves look different and also colours!

I am glad that I finally got an interesting interactive result 🙂