Ziningy1-project 11

sketch

//Zining Ye 
//15104 lecture 1 recitation C
//ziningy1@andrew.cmu.edu 
//Project-10 

var mturtle;
var angle=90;
var path=10;

function setup(){
    createCanvas(480,480);
    background(150,170,200);
    frameRate(20); //set the framerate 
    mturtle=makeTurtle(width/2,height/2);
}

function draw(){
 
        
        for(var i=0;i<4;i++){ //make the turtle draw a square
        
        mturtle.setWeight(1)
        mturtle.left(angle);
        mturtle.forward(path);
    }

 mturtle.setColor(color(random(0,150),random(50,150),random(0,255))); //set the randomness of the color 
    mturtle.penUp();
    mturtle.right(2); //turn 2 degree every time it loops 
    path+=0.3 //the length of the square increases 
    mturtle.penDown(); 
    

}


function turtleLeft(d){this.angle-=d;}function turtleRight(d){this.angle+=d;}
function turtleForward(p){var rad=radians(this.angle);var newx=this.x+cos(rad)*p;
var newy=this.y+sin(rad)*p;this.goto(newx,newy);}function turtleBack(p){
this.forward(-p);}function turtlePenDown(){this.penIsDown=true;}
function turtlePenUp(){this.penIsDown = false;}function turtleGoTo(x,y){
if(this.penIsDown){stroke(this.color);strokeWeight(this.weight);
line(this.x,this.y,x,y);}this.x = x;this.y = y;}function turtleDistTo(x,y){
return sqrt(sq(this.x-x)+sq(this.y-y));}function turtleAngleTo(x,y){
var absAngle=degrees(atan2(y-this.y,x-this.x));
var angle=((absAngle-this.angle)+360)%360.0;return angle;}
function turtleTurnToward(x,y,d){var angle = this.angleTo(x,y);if(angle< 180){
this.angle+=d;}else{this.angle-=d;}}function turtleSetColor(c){this.color=c;}
function turtleSetWeight(w){this.weight=w;}function turtleFace(angle){
this.angle = angle;}function makeTurtle(tx,ty){var turtle={x:tx,y:ty,
angle:0.0,penIsDown:true,color:color(128),weight:1,left:turtleLeft,
right:turtleRight,forward:turtleForward, back:turtleBack,penDown:turtlePenDown,
penUp:turtlePenUp,goto:turtleGoTo, angleto:turtleAngleTo,
turnToward:turtleTurnToward,distanceTo:turtleDistTo, angleTo:turtleAngleTo,
setColor:turtleSetColor, setWeight:turtleSetWeight,face:turtleFace};
return turtle;}


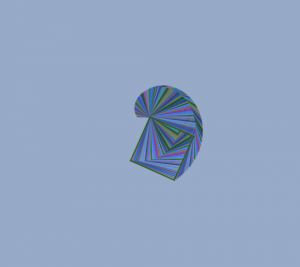
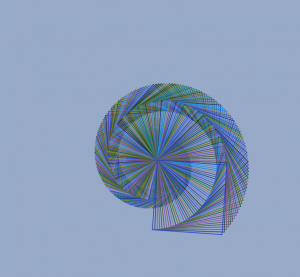
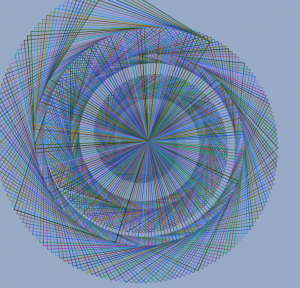
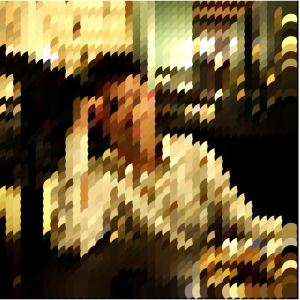
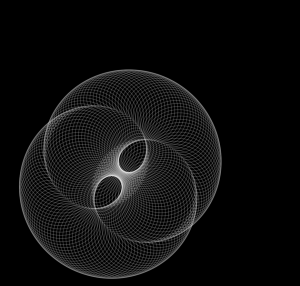
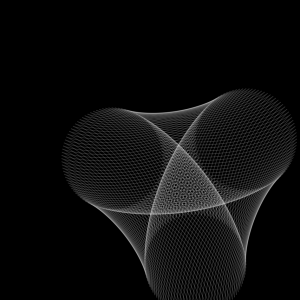
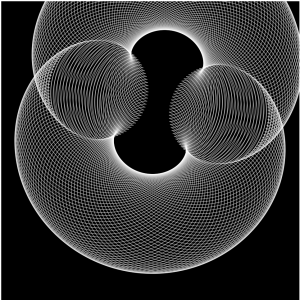
This composition is inspired by one of the lecture notes where we put put the turtle codes in the draw function, so this way it loops and draws the pattern gradually. I made the square shape rotates certain degree everytime, while it is also growing in size.

Ziningy1-section c-Looking Outwards 11


SugarCube, developed by researcher samanda ghassaei at the MIT Media Lab, is an open source, grid-based, standalone MIDI instrument that can be booted up into various musical applications. With the built in accelerometer and gyroscope, SugarCube integrates the physical interaction of tilting, pushing and shaking etc. with the digital music MIDI Notes(shown in the video). It immediately gave a very tangle aspect of computational sound effect. On the other hand, Sugar Cube also afford a variety of ways that users can compose music through the interaction. Such as in the boiling app interaction, users will be able to experiment and create interesting polyrhythms with visual bouncing lights. While the users are pushing the cube buttons to add note to the rhythms, the visual Bounce direction is based on y tilt and Speed and MIDI velocity (loudness) controlled by pots. I assumed that the creators may originally concern with the variety of interaction getting too complex, there is a very user-friendly shake to ease function added to the product. Overall, I am very impress how Sugar cube links the digital music generating aspect with lighting visuals and analog interaction in a very intuitive way.


Ziningy1 – Section C – Project 10 Generative Landscape

The concept behind this project is the rotating sushi bar I used to love when i was a child living in china. The sushi chef will prepare the sushi in dishes and place them on top of the transporting track. Customers will just wait and select the different sushi and sea food dishes they want. So I drawn this graphic sushi bar from the customer standing perspective. The dishes will change randomly between two types: Sushi roll, Sushi and fish head that I illustrated. It will also generate randomly size and color of the dishes.

sketch

//Zining Ye 
//15104 lecture 1 recitation C
//ziningy1@andrew.cmu.edu 
//Project-10 
var speed= -4;
var linex=-100;
var disk = [];
var sushilink = 
["https://i.imgur.com/b6hRo0j.png",
"https://i.imgur.com/QaOb647.png",
"https://i.imgur.com/099E6kA.png"] 

var roll;
var sushi;
var fish;

function preload(){ //load sushi image 
    roll= loadImage(sushilink[0]);
    fish= loadImage(sushilink[1]);
    sushi=loadImage(sushilink[2]);


}

function setup() {
    createCanvas(480, 480); 
    var rx = 0;
    // create an initial collection of disks 
    for (var i = 0; i < 30; i++){
        disk[i] = makeDisk(rx);
        rx+=250;
    }
    frameRate(10);
}


function draw(){
    background(80);
    translate(0,-20); //frame shift upward 

    sushiBar(); //calling sushi bar function 
    displayLine();
    updatedisplayDisk(); //call disk draw funciton 
    displayChopstick(); //calling chopstick draw function 
    displayChopstick1(); //calling second chopstick function 


}

function sushiBar(){ // drawing of the sushi bar 
    noStroke();

    //drawing the transporting trail 
    fill(120,120,90);
    rect(0,0,width,120);
    fill(220,180,130);
    stroke(0);
    strokeWeight(3);
    rect(0,height/2-140,width,20);
    fill(170,140,100);
    strokeWeight(1);
    rect(0,height/2-130,width,20);
    fill(180);
    strokeWeight(3);
    rect(0,height/2-120,width,150);
    //drawing the sushi counter
    fill(220,180,130)
    rect(0,height/2+30,width,10);
    strokeWeight(1);
    fill(170,140,100)
    rect(0,height/2+39,width,10);
    strokeWeight(1.5);
    fill(190,170,130)
    rect(0,height/2+49,width,80);
    fill(230,220,190)
    rect(0,height/2+129,width,140);
}

function updatedisplayDisk(){ //keep the sushi and disk display

    for(var i=0;i<disk.length;i++){
        disk[i].move();
        disk[i].display();
    }
}


function diskMove(){ //moving the disk by updating the speed 
    this.x += this.speed; 

}

function displayDisk(){ //drawing the disk 
    push();
    fill(this.color);
    //line(30,height/2-120,30,height/2+30)
    strokeWeight(2); //the ellipse of the plate 
    ellipse(this.x,this.disky,this.diskw,this.diskh);
    fill(120);
    noStroke();
    ellipse(this.x+5,this.disky+10,80,30); //shadow of the food 


    //deciding which food will be on the plate  
    if(this.food == roll){

        image(roll,this.x-230,50,roll.width*0.7,roll.height*0.8);  
        rectMode(CENTER);
        fill(250);

    }else if(this.food == fish){
        fill(0);
        image(fish,this.x-70,120,fish.width*0.8,fish.height*0.8);  
    } else{

        image(sushi,this.x-190,70,roll.width*0.6,roll.height*0.7);  

    }
    
    pop();


}
function displayLine(){

    push();
   
    //drawing the sushi trail 
    stroke(0);
    strokeWeight(2);
    for(var i=0; i<300;i++){
    var space = i*30
    line(linex+space,height/2-120,linex+space,height/2+30);
    }
    linex += speed
    pop();


}

function displayChopstick(){ //drawing of the chopstick 

    translate(-120,0);
    var chopx=190
    var chopy1= height/2+180
    var chopy2= height/2+192
    fill(90,80,70);
    noStroke();
    rect(chopx+17,chopy1-10,7,38);
    fill(120,120,70);
    rect(chopx+17,chopy1-10,7,33);
    strokeCap(ROUND);
    stroke(220,70,60);
    strokeWeight(6)
    line(chopx,chopy1,chopx+120,chopy1)
    line(chopx,chopy2,chopx+120,chopy2)
    stroke(20);
    line(chopx+90,chopy1,chopx+120,chopy1)
    line(chopx+90,chopy2,chopx+120,chopy2)
    stroke(190,190,20);
    strokeCap(SQUARE);
    line(chopx+85,chopy1,chopx+90,chopy1)
    line(chopx+85,chopy2,chopx+90,chopy2)
}

function displayChopstick1(){ //same chopstick drawing copyed to a different position 

    translate(220,0);
    var chopx=190
    var chopy1= height/2+180
    var chopy2= height/2+192
    fill(90,80,70);
    noStroke();
    rect(chopx+17,chopy1-10,7,38);
    fill(120,120,70);
    rect(chopx+17,chopy1-10,7,33);
    strokeCap(ROUND);
    stroke(220,70,60);
    strokeWeight(6)
    line(chopx,chopy1,chopx+120,chopy1)
    line(chopx,chopy2,chopx+120,chopy2)
    stroke(20);
    line(chopx+90,chopy1,chopx+120,chopy1)
    line(chopx+90,chopy2,chopx+120,chopy2)
    stroke(190,190,20);
    strokeCap(SQUARE);
    line(chopx+85,chopy1,chopx+90,chopy1)
    line(chopx+85,chopy2,chopx+90,chopy2)
}


function makeDisk(diskx){ //object of the disk 

    var disk = {x: diskx, 
                disky: 200,
                diskw: random(100,200),
                diskh: random(70,130),
                speed: -4.0,
                move: diskMove, 
                display:displayDisk,
                color: random(190,230),
                food: random([roll,fish,sushi])
    }

     return disk; 
}


Ziningy1 – Section C – Looking Outwards 10


Graduated with a MFA degree in media art in UCLA, Nova Jiang is a visual artist that work with computational system that are structurally open and aim to evoke the tactile and creative participation of the audience. When I was browsing through her website, my attention was attracted to this little garden-like installation project called Landscape Abbreviated. Landscape Abbreviated is a kinetic maze consisting of modular elements with rotating planters, which form a garden that is simultaneously a machine. The planters are controlled by a software program that continuously generates new maze patterns based on mathematical rules; they rotate to form shifting pathways that encourage visitors to change direction and viewpoints as they move through the space. I really enjoyed this project as it combines the rigorous software system with the organic setting to induced the unpredictable element in the experience. It is also highly immersive while the participants are in the maze, and the randomly moving planters in a way influences the viewers to be more conscious and sensitive surroundings. Through the changes in maze, visitors will be presented a variety of different perspectives to enjoy the whole installation, which also adds on to the overall immersive experience.

ziningy1 – section c – project 09

After being inspired by Professor Golan’s work, I decided to approach this project by laying a grid of circles on the picture. The grid using the nested for loop will create a sense of geometric order of the display. I also find it interesting that I can play with the visibility of the content by adjusting the size of the circles. So I added the Mouse Pressed so that when pressed the circle will become larger, which will gradually shows a clearer version of the picture.

*Please load my project in Safari browser, the chrome browser does not really load, thanks.

First look

After few clicks

After more clicks

sketch 

//Zining Ye 
//15104 lecture 1 recitation C
//ziningy1@andrew.cmu.edu 
//Project-08

var backimage;

var size1=1; 

function preload() { //preload the image 
    var ImageURL = "https://i.imgur.com/JuT5ojz.jpg"
    backimage = loadImage(ImageURL);
}

function setup() {
    createCanvas(400, 400);
    background(0);
    
    backimage.loadPixels(); //load the pixel of the images 


}

function draw() {

    var space1=10; //spacing of the balls 

    //creating a for loop the circle grids 
    for(var i=0;i < 50; i++){ 

        for(var j=0; j < 50; j++ ){

            
            var ex=i*space1;
            var ey=j*space1; 
            var space=10;
            var brightness = backimage.get(ex,ey) // gets the color from the back image 
            fill(brightness); //fill the color 
            noStroke(); 
            ellipse(ex,ey,size1,size1); // draw the circles 
            
        }
    }
    
}

function mousePressed(){

    size1+= 2 // when mouse pressed the circles become larger so that the image become clearer


}


Ziningy1 – Looking Outward 09

For this week’s Looking Outward, I chose Superwat’s Post on week 7 post of Computational Information Visualization: https://courses.ideate.cmu.edu/15-104/f2017/2017/10/13/svitoora-07-font-map/

Actual Project:http://fontmap.ideo.com/


So the Front Map is a exploration from designer at IDEO to address the pain point of designers looking for a proper font. With the aid of utilizing Artificial Intelligence,  the IDEO team was able to create an insightful and valuable tool that facilitate designers’ decision making. The Font Map is a computer(machine learning algorithm) generated visualization of 750 fonts and those font are arranged according to their visual relatedness. It is very impressive as a design student to see this kind of tool designed to help the design process. I indeed agree with what Superwat indicated in his post that the visualization map definitely provide more information on the interaction between fonts. When I was also reading other articles on this project, I found this interesting metaphor commenting the map, “Imagine the map as a country, where the font samples are the locals. As you travel between the different lands, the local dialect changes very slightly. In this example, the dialect is a metaphor for the different fonts that are spread across the map. ” If it is not the computer algorithm, It will be painstaking for people to analyze each font and organizing them into this kind of visualization. Inspired by this project and also looking into the current progress on computer vision, I suddenly felt that we as designers are also entering a new era where computer will be more involved in our design process. Image processing, for example, might able to generate simple similar iterations for a graphic design, which might help the designers making small twists. I can also imagine that image processing technology will help graphic designers to find other designers that may have the similar styles and aesthetics. I am always excited to see how the emerging technology can facilitate creative process such as design and art.

Ziningy1-Looking Outward 1-Looking outwards 08

I am always very interested in how data can be used to create meaningful visualizations. So as I was browsing through the Eyeo Festival, I immediately spotted theSpeaker Sarah Williams and her project on the Nairobi Transportation System. Sarah William is a associated professor of technology and urban planning at MIT, and also the director of the Civic Data design Lab. So she started her presentation by introducing what is motivating her doing what she has being working on. With a strong interest in using data to facilitate urban planning, She promotes while we are massively collecting and researching data, we should pay more attention on how wecan use the data. Thus regarding the data visualization, she indicated that new visualization of data exposing pattern in the world and revolute the way people perceive information. And many examples was shown in her presentation specifically mapping systems. Williams also indicate there is legitimacy in map that “map is powerful, power is the ability to do work, which is what maps do, they work.” After introducing the motives and her research areas, Sarah Williams started to talked about the Digital Matatus project she did. Digital Matatus is a collaborative Mapping system for public transits in Nairobi. So in Nairobi, Matatus are the current loosely self-organized “bus” system. However due todiverse Matatus companies that lack of a uniformed organization, Nairobi people are having a hard time to make sense of the entire matatus system and navigate effectively through them.  So Williams and her team collaborated with students from the University of Nairobi and collected data locally with the Matatus drivers and frequent passenger, who can identify different routes and stops. After the data is collected, they developed this visualization with color coded routes along with the GTFS compatible data structure. It is interesting on how they dealt with the huge chaotic data and draw the map diagrammatically along 45-90 angles so that the user will be able to make sense of directions much more easily. The map also become the official matatus map in Nairobi and instantly have many of the users from the local Nairobi citizens, so it is really inspiring that how a simple visualization would actually affect a community by facilitating a more efficient transportation system. On the hand, I really admire the fact that Williams make the data completely open to the public so that the government and other tech organization can build upon it. Base on the data, several digital application are made for easier access to the Matatus schedule as well as cash-free cards for faster payments. Overall, witnessing all the design process and changes being made in the Nairobi society, I am really inspired on how data and visualization can solve social problems in a such effective way.


Ziningy1 – section c – looking outward 07


Chris Harrison, CMU HCII professor, is one of the professors I admired in CMU. While I always stalking the projects he lead of the Future Interface Group, I was surprised to find out about some of his amazing data visualization project. The Cluster Ball project is a data visualization he made to represent the structure and interconnection of wikipedia pages. Centered in the graph is a parent node. Pages that are linked from this parent node are rendered inside the ball. Finally, pages that are linked to the latter (secondary) nodes are rendered on the outer ring. Links between category pages are illustrated by edges, which are color coded to represent their depth from the parent node. I found it very intriguing that how Prof Harrison managed to create order and structure out of the extremely chaotic wikipedia pages. The way of visualization not only shows how topics are forming topics groups and the degree of linkages, but also reflect the way people organize informations through seeing where the fields diverge and intersect. The visualization can also presented which area of topics may have more concern from the public(more linkages), and which topics may be omitted(less clustered).

Ziningy1-Section C- Project 07 Curves

In this project, I chose the Astriod and Deltoid curve equations. I was originally trying to combine the two curves, yet I found it visually too clustered. So I made it alternating when mouse is pressed. Basically, the mouse movement will determine the the rotation speed, the size and form of the curves. I also modified the transparency so that the curves will be brighter when it is bigger in shapes and darker when is smaller, which I intended to create a sense of perspective in the space.

sketch

//Zining Ye 
//15104 lecture 1 recitation C
//ziningy1@andrew.cmu.edu 
//Project-07

var t=1; 
var state; //set state for changes when mouse pressed 

function setup() {
    createCanvas(480, 480) 

    state = 1; //start with state 1 
    
}

function draw() {
    background (0);
    var offset=0; 

    translate(width/2, height/2-offset); //move curve to center 
    angleMode(DEGREES);

    t+=1+(mouseX+mouseY)/40;  //change rotation speed according to mouse position
    rotate(t); //rotate around center 
    pattern(); // call pattern function and draw the shape
   
   
}


function hypocycloid(){
    var a= 30; 
    var points=500; 


    var n = map(mouseX,0,width,70,150); //map the changing ranges  
    

    noFill();
    stroke(255,255,255,(mouseX+mouseY)/8); // change opacity with mouse movement 

    beginShape();
    
    for (var i=0; i<points; i++){

        //map angle changing range to 0-360 degree
        var t=map(i, 0, points, 0, 359);

        //curve equation 
        var x=1/3*n*(2*cos(t)+cos(2*t));
        var y=1/3*n*(2*sin(t)-sin(2*t));


        vertex(x,y);
    }

    endShape(CLOSE); 
}

function astroid(){

    var points=500; 

    var a=map(mouseX,0,width,5,40); //map the size change range 


    noFill();
    stroke(255,255,255,(mouseX+mouseY)/8); //change opacity with mouse movement 


    beginShape();
    for (var i=0; i<points; i++){

        //map angle changing range to 0-360 degree 
        var t=map(i, 0, points, 0, 359);
        
        //curve equation 
        var x=3*a*cos(t)-a*cos(3*t);
        var y=3*a*sin(t)-a*sin(3*t)

    
        vertex(x,y);

    }
    endShape(CLOSE);
}


function pattern(){


    for(var i=0; i<100; i++){ 
        
        //set x,y position that it goes in draw the shapes in a circle
        var x=5*cos(3.6*i);
        var y=5*sin(3.6*i);

        translate(x,y) //change postiion to draw shapes 


        //determine which curve to present 
        if (state == 1){
            hypocycloid();
        } else {
          astroid();  
        }
    }
}


function mousePressed(){

    //when mouse pressed, the state changes, so the curve chaneges. 
    if (state == 1){
    state = 2;
    } else {
        state = 1;
    }
}


ziningy1 – section c – project 06 – abstract clock

I start this project by considering what aspects can be manipulated with the passage of second, minute and hour. So I come up with the idea of growing size, color and transparency. Based on simple arc shapes, the second, minute and hour arc will change all those aspects in different rate. The second hand, for example, will change most dramatically so it creates this exploding effect every minute.

preliminary sketch:

sketch

//Zining Ye 
//15104 lecture 1 recitation C
//ziningy1@andrew.cmu.edu 
//Project-06


function setup() {
    createCanvas(480, 480) 
    
}

function draw() {

    var s = second();  
    var h = hour(); 
    var m = minute(); 
    var centerx= width/2;
    var centery= height/2;
    var adjust = 90;
    var gunit = 10; //growing rate  


    angleMode(DEGREES);
    background(220);


    // second hand(arc)
    // convert the 60 seconds to 360 degree 
    var slength = map(s,0,59,0,359); 

    //the color changes with the second changes 
    fill(5*s,s*2,s*2,2*gunit*(s/4));
    noStroke();
    //draw the second arc, the size will grow with time  
    arc(centerx,centery,gunit*s,gunit*s,0-adjust,slength-adjust);

    //convert the 60 minutes to 360 degree 
    var mlength = map(m,0,59,0,359); 
    //color changes as the second hand
    fill(4*m,m,m,gunit*(m/4));
    noStroke();
    //size also grow with time with a smaller rate 
    arc(centerx,centery,5*m,5*m,0-adjust,mlength-adjust);

    //convert the 24 hours to 360 degrees 
    var hlength = map(h,0,23,0,359); 
    fill(4*h,h/2,h/2,gunit*h/3);
    noStroke();
    //size grow in a even smaller rate than minute hand
    arc(centerx,centery,4*h,4*h,0-adjust,hlength-adjust)


}