hdw – Looking Outwards – 07

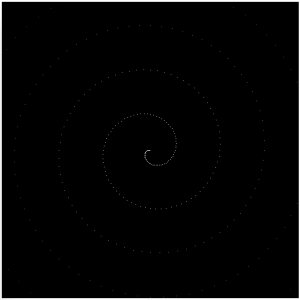
Chris Harrison did a really cool project on internet maps, where he compared internet connectivity of the world, and focused in on North America and Europe especially, as they had the most connections between each other.

Logistically, he mapped out the locations of connectivity by nearest whole number in a coordinate system. The brighter the point, the more points of connectivity there is. Harrison himself says that this approach probably is not indicative of users, as one point of connectivity can have multiple users. However, he chose the data and representation style based on an aesthetic approach, as there are already many other practically modeled ones existing. You can read more about it here.
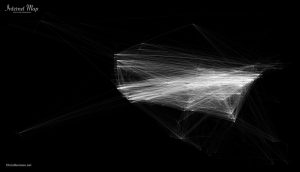

Internet connectivity of Europe
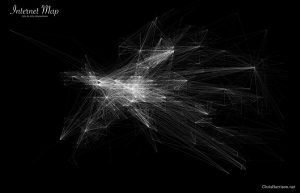

Internet connectivity of North America
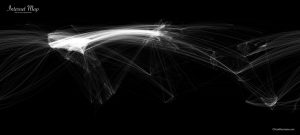

Internet connectivity of the World

I love how delicate the lines are and how orderly the grids look, zoomed in. Because Harrison rounded connectivity locations to nearest longitude and latitude, it looks like it follows a coordinate grid system. The contrast between order and chaos gives the appearance of string art.

yushano_Project 7 – Curves

sketch


function setup() {
    createCanvas(400, 400);
    frameRate(10);
}


function draw() {
    background(226,236,236);
    
    strokeWeight(2);
    noFill();
    
    // draw the curve
    push();
    translate(width / 2, height / 2);

    // the curve inside
    for (var i = 0; i < 8; i++) {
        var r = 207-(207-152)/6*i;
        var g = 171-(171-92)/6*i;
        var b = 177-(177-103)/6*i;
        stroke(r,g,b);
        drawTetracuspidCurve();
        rotate(PI/14);
    }

    // the circle curve outside
    for (var i = 0; i < 6; i++){
        var r = 215-(215-147)/6*i;
        var g = 195-(195-126)/6*i;
        var b = 186-(186-118)/6*i;
        stroke(r,g,b);
        drawRanunculoidCurve();
        rotate(PI/3);
    } 
    pop();


}

function drawRanunculoidCurve() {
    var nPoints = 100;
    var x;
    var y; 
    var a = 100;
    var b = a / 5;   
    var ph = mouseX / 40;
    // control the shape in two opposite sides
    if (mouseY <height/2){
        var h = constrain(mouseY / 8, 0, b);
    } else {
        var h = constrain((height - mouseY) / 8, 0, b);
    }
    
    beginShape();
    for (var i = 0; i < nPoints; i++) {
        // map the points onto angles
        var t = map(i, 0, nPoints, 0, TWO_PI);
        x = (a + b) * cos(t) - h * cos(ph + t * (a + b) / b);
        y = (a + b) * sin(t) - h * sin(ph + t * (a + b) / b);
        vertex(x, y);
    }
    endShape(CLOSE);    
}

function drawTetracuspidCurve(){
    var nPoints = 200;
    var x;
    var y;
    var a = 120;
    var ph = mouseX / 40;

    beginShape();
    for (var i = 0; i < nPoints; i++) {
        var t = map(i, 0, nPoints, 0, TWO_PI);
        x = a / 4 * (3*cos(t) -  cos(ph + 3 * t));
        y = a / 4 * (3*sin(t) +  sin(ph + 3 * t));
        vertex(x, y);
    }
    endShape(CLOSE);    
}


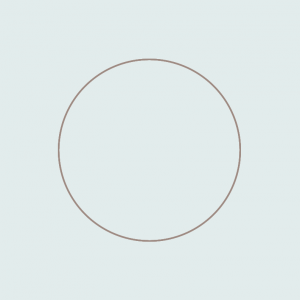
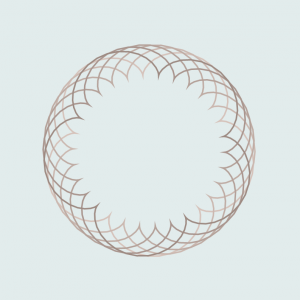
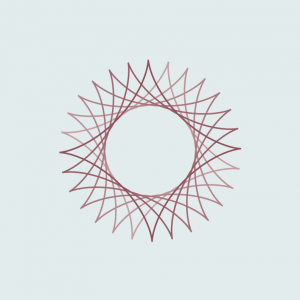
Above are the process of my work. So, I combined two different kinds of curves in my project: Ranuncuidloid and Tetracuspid curves. The first shape is inspired from the form of flowers, and the other is inspired from the shape of a star. These two curves are all rotatable according to the x-coordinates of the mouse. Also, the flower shapes is generated from the y-coordinates of the mouse. The flower shape is more visible if the y-coordinates of your mouse is more towards the center, is like the flower is blooming. This project helps me understand more about the use of translate() and rotate(), which are my weakness. Also, I learned about many control elements in the curve equation, which is also meaningful.

heeseoc-Project-07-Curves

sketch

//Steph Chun
//15-104 section #A
//heeseoc@andrew.cmu.edu
//Project-07

var a = 30;
var b = 10;
var t = 500;
var h = 80;

function setup() {
    createCanvas(400, 400);
    frameRate(10);
}

function draw() {
	background(0);
	stroke(255);

	push();
	translate(width/2, height/2);
	beginShape();

	//lines//
	for (var i = 0; i < 50; i++) {
		var Xcoord = ((a-b)*cos(i))+(h*cos(((a-b)/b)*i));
		var Ycoord = ((a-b)*sin(i))+(h*sin(((a-b)/b)*i));
		var Xcoord2 = ((a-b)*cos(i-t))+(h*cos(((a-b)/b)*(i-t)));
		var Ycoord2 = ((a-b)*sin(i-t))+(h*sin(((a-b)/b)*(i-t)));
		b = mouseX + 650;
		line(Xcoord + random(-3, 3), Ycoord+ random(-3, 3), Xcoord2+ random(-3, 3), Ycoord2+ random(-3, 3));
    	
    	//bubbles//
		push();
		rotate(i);
    	ellipse (i + random(-3, 3), Ycoord, 2, 2);
    	ellipse (i + random(-3, 3), Ycoord2, 4, 4);
    	ellipse (Xcoord, i + random(-3, 3), 2, 2);
    	ellipse (Xcoord2, i + random(-3, 3), 4, 4);
    	pop();
    }
    endShape(CLOSE);
    pop();
    
    //bigger circle//
    push();
    translate(width/2, height/2);
    beginShape();
    for (var i = 0; i < 20; i++) {
    	fill(255, 50);
        var theta = map(i, 0, 20, 0, TWO_PI);
        var x = mouseX * 0.25 + 60;
        var px = x * cos(theta);
        var py = x * sin(theta);
        vertex(px + random(-3, 3), py + random(-3, 3));
    }
    endShape(CLOSE);
    pop();

    //smaller circle//
    push();
    translate(width/2, height/2);
    beginShape();
    for (var i = 0; i < 20; i++) {
    	fill(0);
        var theta = map(i, 0, 20, 0, TWO_PI);
        var x = mouseX * 0.25 + 20;
        var px = x * cos(theta);
        var py = x * sin(theta);
        vertex(px + random(-3, 3), py + random(-3, 3));
    }
    endShape(CLOSE);
    pop();

}

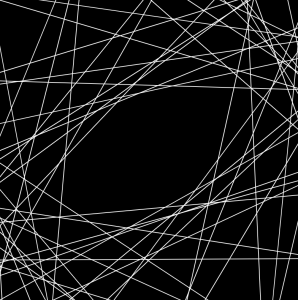
For this project, I started off with browsing mathworld website and finding the curve that we would want to use. I chose hypotrochoid. Then, I tried to generate that curve through coding, and what I found out was at some point, the lines that I made through the equation I chose made an eye-shaped form at some point, so I restricted the mouse movement to have it start from the shape and added wiggly circles in the middle of those lines. I added the wiggly bubbles in the back because it felt like it needed some more elements to it to have some sort of a visual balance. I kept all the colors white, because I did not want it to be way to literal in communicating my “zooming into an eye” idea. Below is the screenshot of the shape I got inspired from.

hdw – Project 7 – Curves

sketch

//Helen Wu
//Section A
//hdw@andrew.cmu.edu
//Project 7

function setup() {
    createCanvas(480,480);
    background(255, 71, 123)
}


function draw() {
  push();

  //this is to call the centers of which the sextic functions will be called from
  translate(width/2, height/2);
  beginShape();
  for(var i = 0; i < 25; i++){
    //25 sets the direction of which the curves draw
      var t = map(i,0,100,0,360);
      //t = angle
      var a = map(mouseY, 0, 480, -5, 5);
      //a = control the curvature of the loops
      var x = 4*a*(Math.pow(cos((1/3)*t),3))*cos(t);
      var y = 4*a*(Math.pow(cos((1/3)*t),3))*sin(t);
      //centerX and centerY = center of smaller curves
      var centerX = 10*x
      var centerY = 10*y
  }
  endShape(CLOSE);
  pop();


//drawing below sextics on points along above sextic
  cayleysSextic(centerX, centerY);
  }

function cayleysSextic(centerX,centerY) {
  push();
  //placement of sextics along center
  translate(width/2+centerX,height/2+centerY);
  beginShape();
  for(var i = 0; i < 50; i++){
      //t = angle
      var t = map(i,0,100,0,360);
      //a = control the curvature of the loops
      var a = map(mouseX, 0, 400, -10,10);
      var x = 4*a*(Math.pow(cos((1/3)*t),3))*cos(t);
      var y = 4*a*(Math.pow(cos((1/3)*t),3))*sin(t);
      //center of smaller loop's smaller curves
      noStroke()
      fill(255,255,255,30);
      ellipse(x*3,y*3,1,1);
      //drawing ellipses along the curve
  }
  endShape(CLOSE);
  pop();
}

This project was based on Cayley’s Sextic, which coincidentally looks like a butt. 👀👀

I mapped Cayley’s Sextic along another Cayley’s Sextic, just to see how it would look. I kind of like how cute the final product turned out to be. The centers of one are along the next, both mapped to the mouse position on the canvas.

mmiller5-Project-07

sketch

function setup() {
    createCanvas(480, 480);
    frameRate(30);
    textAlign(CENTER);
    textSize(60);
}

function draw() {
    background(0);
    curves();
    smile();
}

function curves() {
    var cx = width / 2; //center of width
    var cy = height / 2; //center of height
    var t = 400; //iteration count
    var mx = map(min(mouseX, width), 0, width, 2, 5); //x position of mouse map
    var my = map(min(mouseY, height), 0, height, 2, 5); //y pos. of mouse mapped
    strokeWeight(1);
    for (i = 0; i < t; i ++) {
	var col = map(i, 0, t, 0, 255);
	//logarithmic spiral
	var x = (t - i) * cos(radians(i * mx));
	var y = (t - i) * sin(radians(i * my));
	fill(col);
	stroke(255 - col, 200);
	//make a quadrilateral with vertices at 4 spirals in the corners
	quad(x + width / 4, y + height / 4,
	     x + 3 * width / 4, y + height / 4,
	     x + 3 * width / 4, y + 3 * height / 4,
	     x + width / 4, y + 3 * height / 4);
    }
}

function smile() {
    var cx = width / 2; //center of width
    var cy = height / 2; //center of height
    var md = map(min(dist(mouseX, mouseY, cx, cy), 340), 0, 200, 15, -15);
    stroke(0);
    strokeWeight(3);
    noFill();
    //emoji like eyes, uses actual font, changes if mouse is in face
    if (mouseX > width / 4 & mouseX < 3 * width / 4 &&
       mouseY > height / 4 && mouseY < 3 * height / 4) {
	text("> <", cx, cy - 5);
    } else {
	text("| |", cx, cy - 5);
    }
    //smile, changes size with distance of mouse to center beacuse of var "md"
    arc(cx, cy + 30, 50 + (md / 3), 80 + md, 0, PI, CHORD);
}

Hee hee, this was fun.  I used a parametric form of a logarithmic spiral as the base of this program.  I then wanted to experiment with connecting points from different spirals together (in this case, I had 1 spiral in each corner).  I figured a good way to introduce mouseX and mouseY would be to have them affect the period of revolution (with mouseX affecting the x-position and mouseY affecting the y-position).  I thought the movement looked kinda like a snake, and since the center square was pretty barren, I decided to anthropomorphize the curve with a emoji-like smily face.


Initial logarithmic spiral (not really visible)

ssharada-project-07-composition-with-curves

project04.js


function setup() {
    createCanvas(480, 480);
    angleMode(DEGREES);
    frameRate(50); //delayed feedback so lines appear to draw themselves and disappear
}

function draw() {

//making the colour of the background dependent on the cursor position
    background(mouseX/7.55, mouseY/20, mouseX/15, mouseY/20); 
    //the trasnparency of the backgroud is also dependent on the cursor position

//changing the position of the start point of the curves. 
    translate (width/3,height/2);
    noFill();

//creating the for loop variables for which the angles will change
    for (var i = 0; i < 361; i++){

        //maping the angles so they only go between 0 and 360 
        var t = map(i, 0, 360, 1, 500); 
        
        //making the colours only range 0 and 255 no matter cursor position
        var r = map(mouseX, 0, 1000, 250, 255); 
        var g = map(mouseX, 0, 1000, 120, 130);
        var b = map(mouseX, 0, 1000, 70, 80);

        //making the variables for the points' scaling
        var scale1 = 0.0005;  
        var scale2 = 0.5;
        var scale3 = 0.001;
        var scale4 = 0.4;

        //creating the curves of the graphs that the for loop is going to be used with
        var x1 = -sin(t)+cos(t);
        var y1 = cos(t);
        var x2 = cos(t) + 0.5;
        var y2 = sin(t);

        //creating the stroke colour and varying it according to the cursor position and the for loop
        stroke(r, g, t*(mouseX/800));
        strokeWeight(random(0.01, 0.05));

        line(x1*t*mouseX*scale1, y1*t*scale2, x2*t*scale2, y2*t*mouseY*scale1);
        line(x1*t*scale4, y2*t*mouseX*scale3, x2*t*mouseY*scale1, y2*t*scale4);

        push();
        //rotating the same two curves to create the rose like shape.
        rotate(90);
        
        line(x1*t*mouseX*scale1, y1*t*scale2, x2*t*scale2, y2*t*mouseY*scale1);
        line(x1*t*scale4, y2*t*mouseX*scale3, x2*t*mouseY*scale1, y2*t*scale4);
        
        pop();

    }
    
}


For this assignment I was inspired by a rose bud blooming and I was trying to figure out how to find an abstract way to represent it. I did this by changing the colours and have a frame rate that was slow enough for the lines to look like they were emerging from each other.

I experimented with cosine and sine curves and looked at what would happen if i multiplied, subtracted, added, and divided them from each other. I ended up with the above version because i felt that it represented the idea of the flower blooming the best.

HaeWanPark-LookingOutwards-7

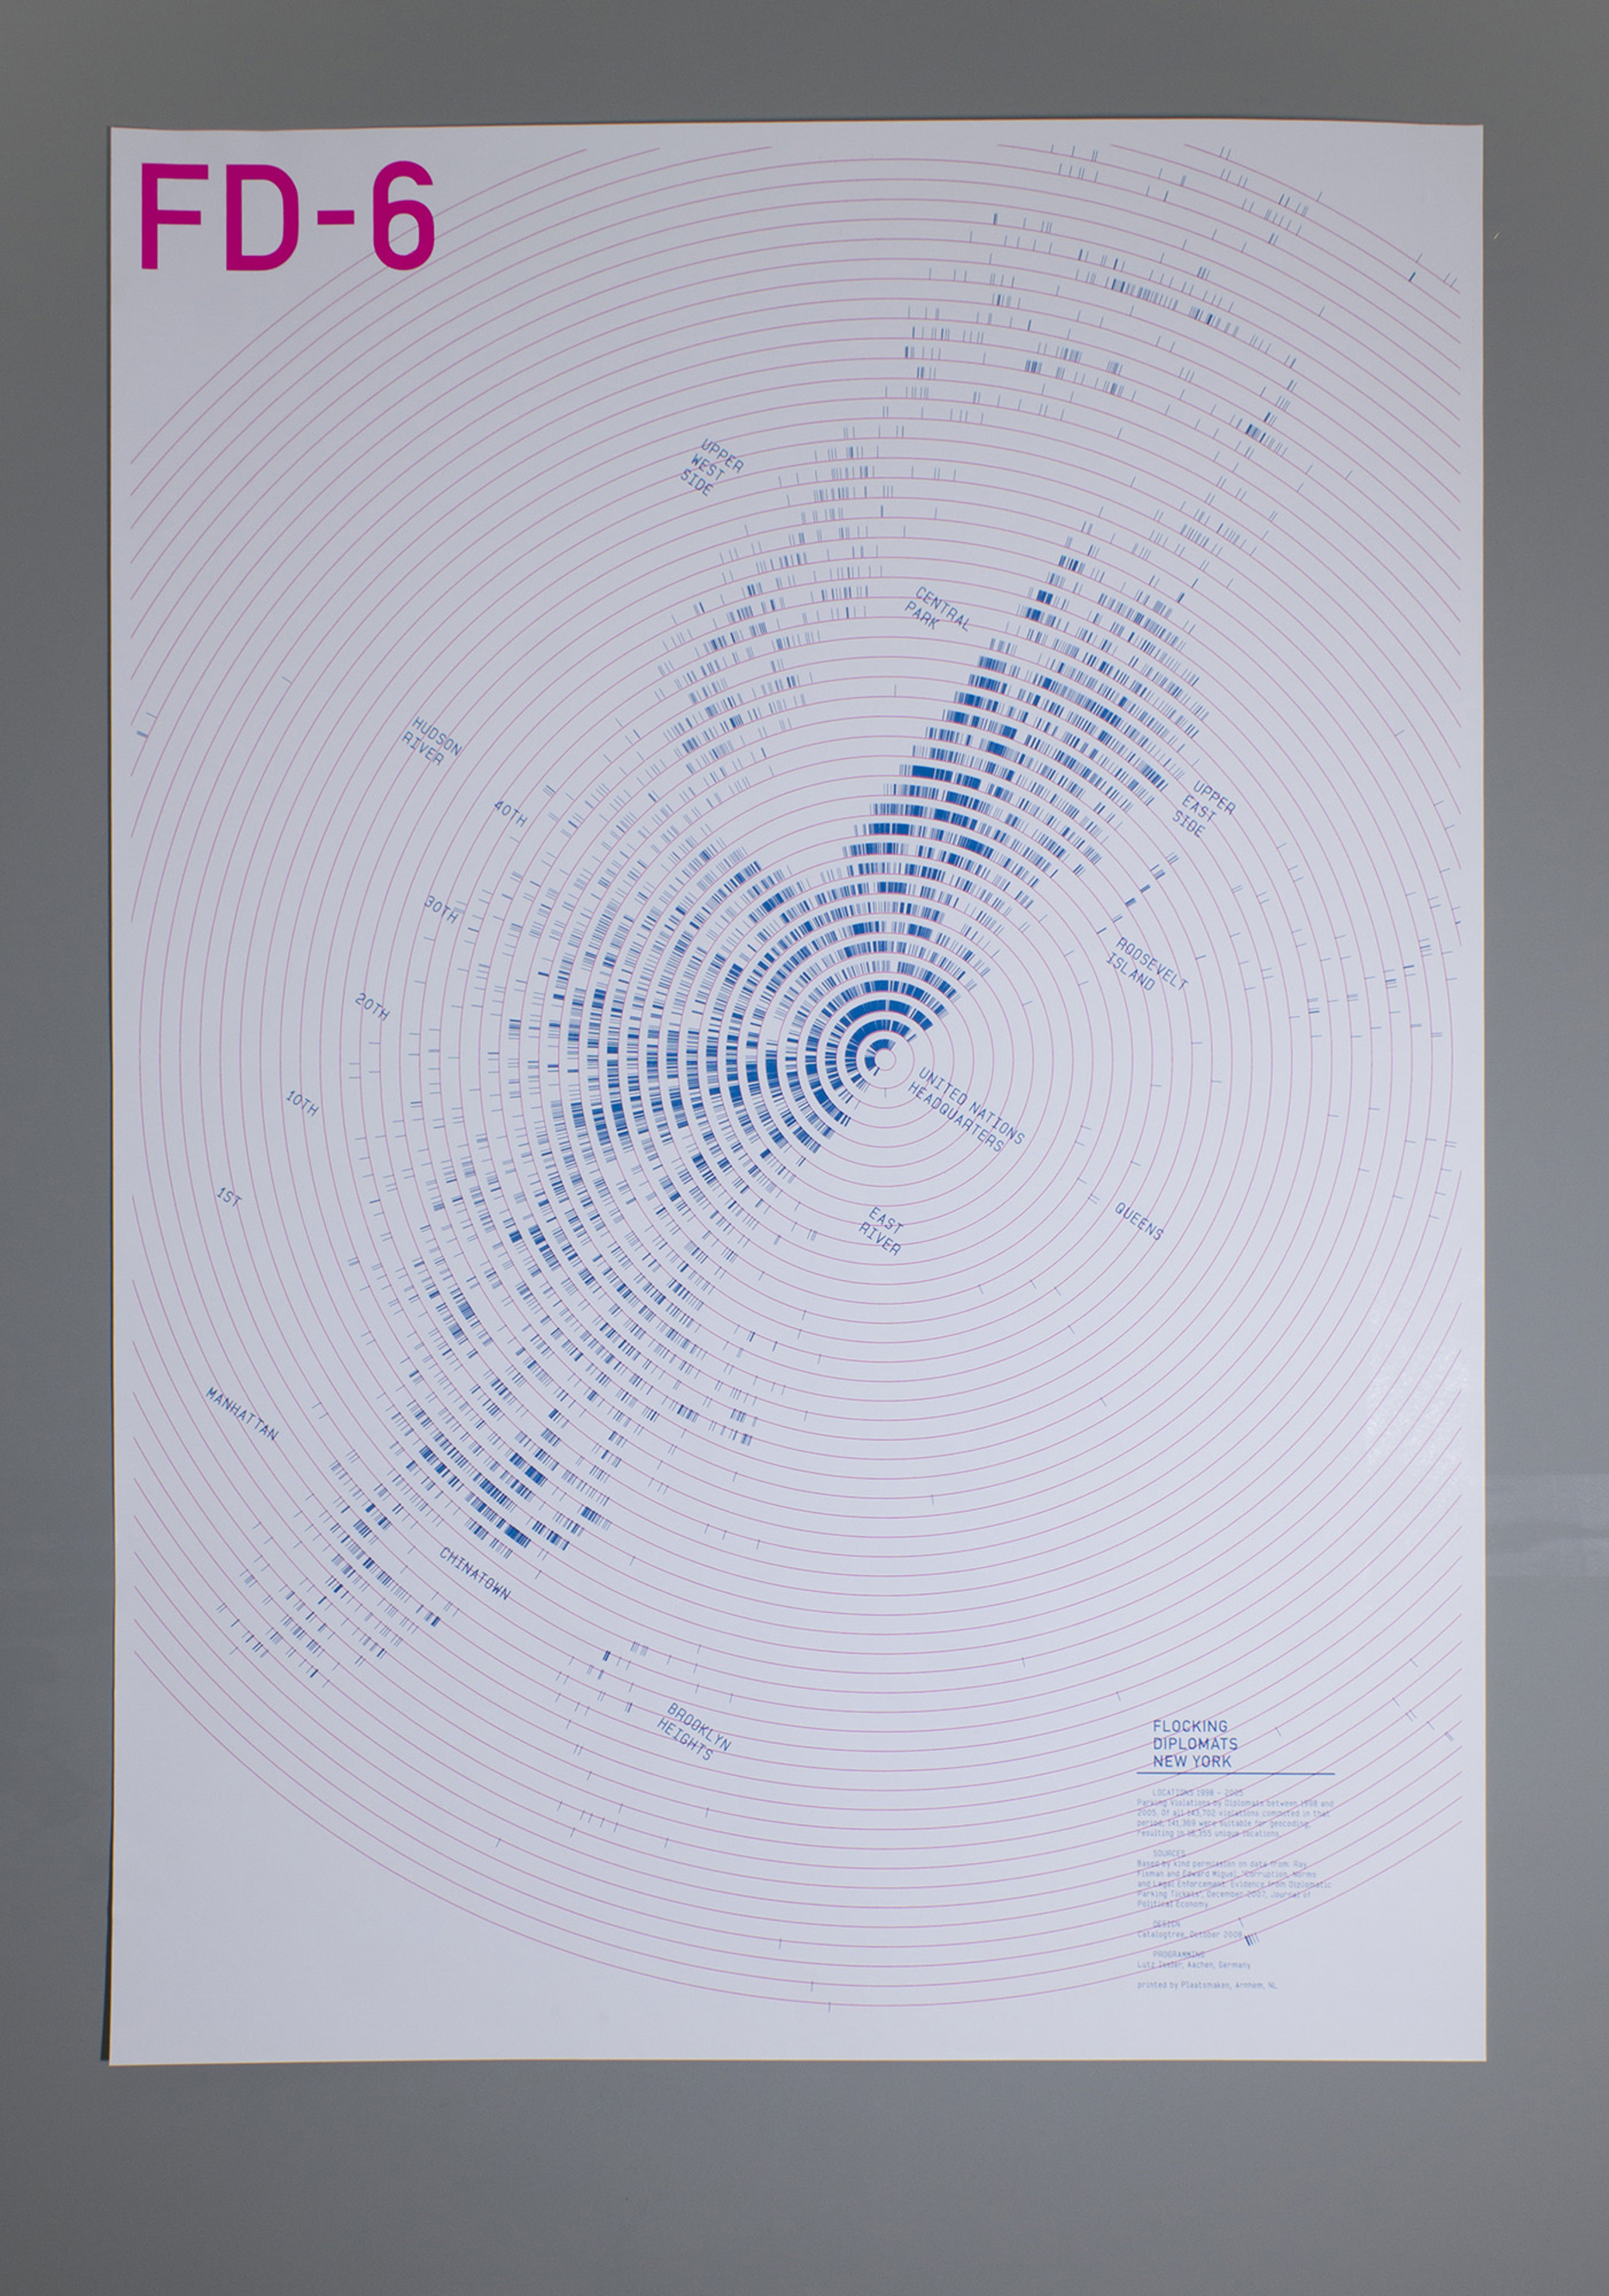
YOU’RE NOT THE ONLY ONE WHO HAS TROUBLE PARKING IN NEW YORK CITY

The Sixth Poster of “Flocking Diplomat” Series

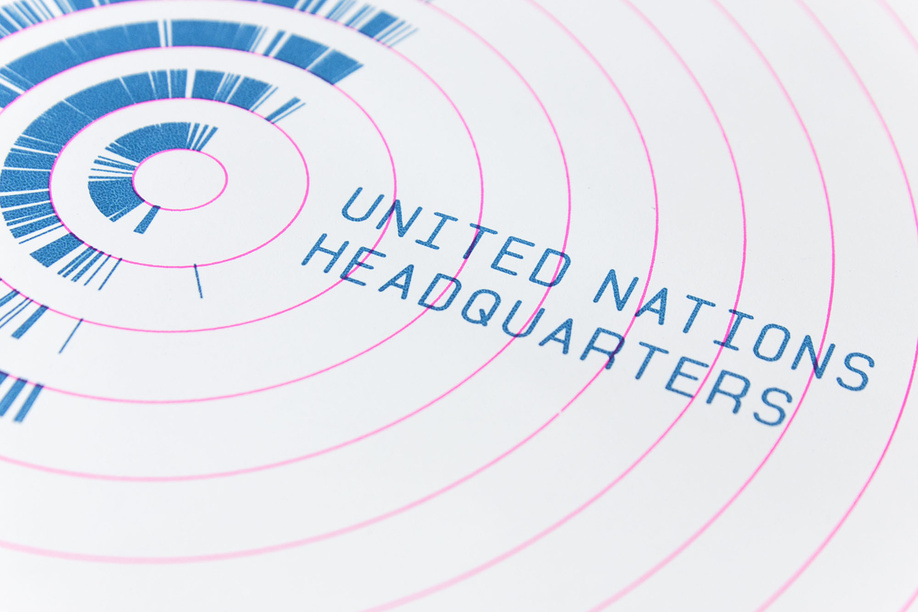
This is the last piece of six poster series named Flocking Diplomat representing Parking Violations by Diplomats in New York City between 1998 and 2005. Each different poster is represented same data but in each unique discipline allowing audiences to engage in a different perspective. The last piece was created by Christina Cannella who is a Digital Design Fellow in the Department of Drawings, Prints & Graphic Design at Cooper Hewitt, Smithsonian Design Museum. Each tick on this poster is marking a parking violation by a diplomat in NYC, 1998 – 2005. This was executed by the loop technique (I think it is what we have been learning in past few weeks) of programming that plotted 141,369 geo-coded data points. It is resulting in 16,355 unique locations and pointing out the United Nation which is the source of the diplomats. So, in this data visualization, viewers can see the hidden patterns behind the data. This poster has been exhibited at Cooper Hewitt, Smithsonian Design Museum.

YOU’RE NOT THE ONLY ONE WHO HAS TROUBLE PARKING IN NEW YORK CITY


amui1 – Project-07-Curves

amui1-p7

//Allison Mui
//15-104 Section A
//amui1@andrew.cmu.edu
//Project-07


//global variables
var nPoints = 100;

function setup() {
    createCanvas(480,480);
}

function draw() {
    background(0,0,63);
    //places bottom left corner
    drawAstroid(70,height-80);
    //places top right corner
    drawAstroid(width-60,80);
    drawRose();
}

function drawAstroid(xPos,yPos) {

    //size
    var a = 30;

    beginShape();
    noFill();


    stroke(255,242,254);
    strokeWeight(1);

    //loops ten times to make layer of astroid
    for (var num = 0; num < 10; num += 1) {
      //test loop
      //print(num);
      //loops through 100 times to make the curve
      for (var i = 0; i < nPoints; i++) {
        //constrains and maps theta to be between 0 and two pi
        var theta = map(i, 0, nPoints, 0, TWO_PI);

        //formulas provided by MathWorld
        x = xPos + a*(cos(theta)**3);
        y = yPos + a*(sin(theta)**3);


        vertex(x,y);

      }
      endShape();
      //decreases size of astroid in accordance with mouseX
      a = a - constrain(mouseX,0,width);
    }
}

function drawRose() {
    stroke(255,252,201);
    noFill();
    //size of rose inm accordance with mouseX
    var roseA = constrain(mouseX,50,200);
    //number of petals
    var roseFactor = 6;

    //loop through 10 times for extra layers
    for (var roseNum = 0 ; roseNum < 10; roseNum += 1) {
      for (var i = 0; i < nPoints; i++) {
        //constrains theta to be between 0 and two pi
        var roseTheta = map(i,0,nPoints,0,TWO_PI);

        //formulas from mathworld
        r = roseA*sin(roseFactor*roseTheta);

        roseX = width/2 + r*cos(roseTheta);
        roseY = height/2 + r*sin(roseTheta);

        ellipse(roseX,roseY,1,1);
      }
      //decreases size of rose in accordance with mouseX
      roseFactor = roseFactor - mouseX;
      //to test
      // print(roseFactor);
    }
}

This project was pretty challenging. I found mathWorld extremely useful in showcasing the x and y equations in order to make the shape. However, I found it difficult to come up with a creative idea that implemented the curve shape. What I came up with was inspired by the stars. Overall, I’m satisfied with my end product. However, in the future, I would like to explore more and maybe implement something new using the time function. Another thing that I wish I could have taken more time researching was finding a way to make the astroid curve into a rose curve over the movement of mouseX. But, that was too hard and too much of a time constraint for the time being. Overall, I’m satisfied with my end product which gives off a “sparkly” feel.

hannahk2-LookingOutwards-07

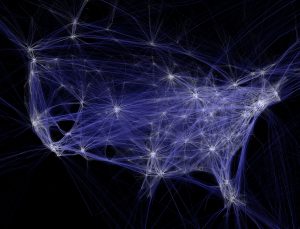
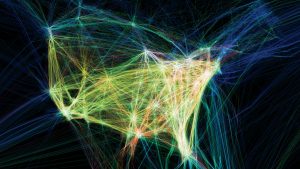
The project I chose for this week is “Flight-Patterns” by artist, Aaron Koblin. It is a computational information visualization project created as a series of experiments for the project, “Celestial Mechanics”. The project basically takes paths of air traffic over North America, and visualizes them in color and form, creating luminescent cotton-like webs of light and paths. To make this project, FAA data was parse and plotted using the Processing programming environment. I admire this project because the artist was able to take something as mundane and repetitive as flight paths, and turn them into a stunning visual map. The lines look like the thinnest strands of thread and resemble the shape of the united states. I can see the artists’ creative sensibilities manifesting in the work, because seeing his other works he is obviously drawn to fragile and delicate, complex and elegant lines. I am also extremely amused by his project, The Single Lane Superhighway, in which he invites visitors of his website to draw a car facing right, using a simple drawing tool he created. After reaching 50,000 cars, he compiled them to drive on a never ending parade on a single line. I thought this was really cute.

http://www.aaronkoblin.com/project/flight-patterns/

http://www.aaronkoblin.com/project/the-single-lane-superhighway/

monicah1-lookingoutward-07

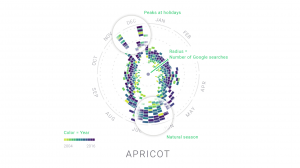
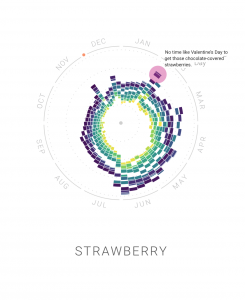
The Rhythm of Food by Moritz Stefaner

This project Mortiz Stefaner works on relating specific food and time of the year. For example, he looked at the human purchase behavior on apricot; The population of purchasing apricot, the amount they buy, and when they buy.

I am interested in this data visualization because I never seen data viz on specific food. When I really look into the visualization. The visual tells me so many information, like stories, seasons, demographic and more. When looking at data viz on strawberry, it interesting to see the anecdote on how strawberries relates to valentines. It would be interesting to see if people are keeping up with the tradition on certain holidays by looking at people behaviors when purchase food. Also, the data viz can clearly support people supply and demand needs.