![[OLD FALL 2017] 15-104 • Introduction to Computing for Creative Practice](https://courses.ideate.cmu.edu/15-104/f2017/wp-content/uploads/2020/08/stop-banner.png)
//
// Supawat Vitoorapakorn
// Svitoora@andrew.cmu.edu
// Section E
//
// Relative Time
//
// This program is a spin-off from
// p5.js program for a very simple "abstract clock"
// Golan Levin, for 15-104 & 60-212
var w = 400;
var h = 400;
var H;
var M;
var S;
var mappedH;
var mappedM;
var mappedS;
var curSec;
var STATS = [];
var prev_stat;
var cur_stat;
// Statistics as objects:
// Internet
var stat_0 = {
event: 8,
mod_sec: 1,
event_per_sec: null,
cycle_time: null,
text: "new people have joined the internet."
}
//Rape
var stat_1 = {
event: 1,
mod_sec: 90,
event_per_sec: null,
cycle_time: null,
text: "women have been raped in the US."
}
// Tree
var stat_2 = {
event: 150,
mod_sec: 60,
event_per_sec: null,
cycle_time: null,
text: "football fields of tree is lost."
}
// Cool Math Games
var stat_3 = {
event: 3350000,
mod_sec: 30 * 24 * 60 * 60,
event_per_sec: null,
cycle_time: null,
text: "internet searches have been for cool math games."
}
// Donut
var stat_4 = {
event: 10000000000,
mod_sec: 365 * 24 * 60 * 60,
event_per_sec: null,
cycle_time: null,
text: "doughnuts have been made."
}
// Drop Out
var stat_5 = {
event: 7000,
mod_sec: 60 * 60,
event_per_sec: null,
cycle_time: null,
text: "highschool students have dropped out."
}
// Death
var stat_6 = {
event: 6316,
mod_sec: 60 * 60,
event_per_sec: null,
cycle_time: null,
text: "people have died."
}
// Array of all Statistics
STATS = [stat_0, stat_1, stat_2, stat_3, stat_4, stat_5, stat_6];
// Converts event_per_sec to number of x happening in 1 second
function process_STATS() {
for (i in STATS) {
STATS[i].event_per_sec = STATS[i].event / STATS[i].mod_sec
// Time it takes to complete 1 cycle in milliseconds
STATS[i].cycle_time = (STATS[i].mod_sec / STATS[i].event) * 1000
}
}
//--------------------------
function setup() {
createCanvas(500, 500);
process_STATS();
cur_stat = STATS[1];
prev_stat = cur_stat;
}
// Gives total time in second since midnight.
function total_seconds() {
curSec = (hour() * 60 ** 2) + (minute() * 60) + second();
}
// Draws the clock based on the input statistic.
function draw_clock(stat) {
noStroke();
// Fetch the current time
var S = second();
var M = millis();
var delta = .05; // for easing
// Compute Clock hand with easing
if (abs(prev_stat.cycle_time - cur_stat.cycle_time) > 40) {
// if statement above helps removes jitter from easing
var DELTA = abs(prev_stat.cycle_time - cur_stat.cycle_time);
if (prev_stat.cycle_time <= cur_stat.cycle_time) {
prev_stat.cycle_time += DELTA * delta
} else {
prev_stat.cycle_time -= DELTA * delta
}
mappedS = map(M, 0, prev_stat.cycle_time, 0, 1);
} else {
mappedS = map(M, 0, cur_stat.cycle_time, 0, 1);
}
// My clock
angleMode(DEGREES);
ellipse(w / 2, h / 2, w / 2, w / 2);
// Draw second hands
stroke(0);
strokeWeight(1);
line(w / 2, h / 2,
(w / 2) + cos((mappedS * 360) - 90) * (w / 4) * .95,
(w / 2) + sin((mappedS * 360) - 90) * (w / 4) * .95);
// Create Text
fill(255, 255, 255, 255 * .75);
noStroke();
textAlign(CENTER);
textSize(11.25);
text("Since midnight, " + nfc(floor(stat.event_per_sec * curSec)) +
" " + stat.text,
w / 2, h * .85)
text("Please click for different statistic.",
w / 2, h * .9)
}
// Randomly select a statistic that isn't the current one.
function mousePressed() {
prev_stat = cur_stat;
do {
cur_stat = random(STATS)
}
while (cur_stat == prev_stat);
process_STATS();
}
//--------------------------
function draw() {
background(200, 200, 200);
noStroke();
draw_clock(cur_stat);
total_seconds();
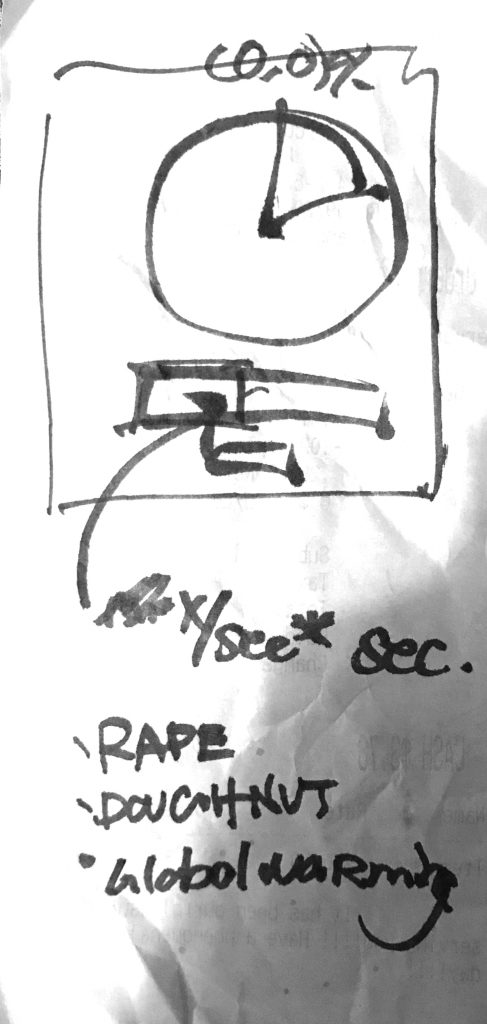
}Relative Time
Statistics of absurd scales are often hard to wrap your mind around. As a designer, I’m interested in ways to help people understand information in the most intuitive way possible so that they can make the best decision. This Relative Time clock is an abstract clock that re-maps itself to a randomly selected statistic that I found on the internet. Some statistics are plain depressing, and some are just for laughs. I hope that this temporal data visualization can all help us better understand our world.