cchau1 – Project04 – String Art

proj04


var spaceX = 2;
var spaceY = 10;
var x1 = 30;
var y1 = 300;
var x2 = 400;
var y2 = 200;

function setup(){
	createCanvas(400, 300);
	background(80,50,255); //different background color to set the mood
}

function draw() {

	for(var i = 0; i < height; i ++){
		stroke(244,25,0); //red sunrays
		line(i*80,x1-3*spaceX,x1+i,y1+spaceX);
    strokeWeight(0.03);
    stroke(240,203,10); //yellow sunrays
    line(i*10,x1-5*spaceY,x1,y1+spaceY+60);
	} //additional numbers were manipulated to fit the canvas size

    for (var k = 0; k < height; k ++) {
      stroke(255); //white space in top right corner; "cloudscape"
      line(x2,spaceY*k,2*spaceY*k,spaceX);
}

    for (var j = 0; j < height; j ++) { //grass
      strokeWeight(2);
      stroke(0,100,0,10);
      line(x1-30,spaceY*j,2*spaceY*j,y1);
    } //the grass and cloudscape are related in increments (reflections)

    var rad = 150 //mock sun
      fill(255,230,0);
      ellipse(rad/4,height-30,rad,rad);
}

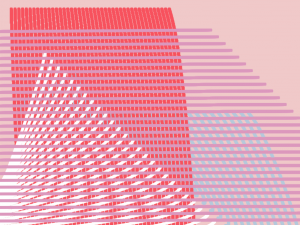
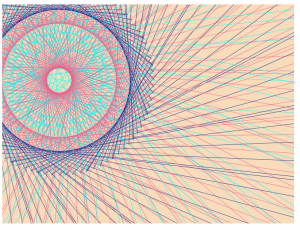
I tried to manipulate and play around with some of the variables, as well as figure out how to coordinate with the dimensions of the canvas. I had an original idea that I eventually tossed out (which involved a sort of “playing field” using “stroke(240,203,10); line(i*30,height/-4,width,(2*height-3)/i);” in the for loop() ). I ended up deciding to manipulate straighter lines and thought that they resembled sun rays which also created a cool color-blending effect in the bottom right corner so I kept it. I made two curves that would represent “grass” and “clouds”. Personally, I like creating objects and shapes more than just mere lines becayse I am not the most familiar with loops yet (though it was fun to figure out the values) but I will probably do more projects like string art in the future!

serinal – project 4 (section C)

my string art isn’t super complex as I didn’t really have a vision of what I wanted it to look like when I started the project, except the fact that I wanted a light color background and a non-super contrasting (color-wise) end product. My favorite part is the little crosshatching component kind of in the background, I think it turned out quite nicely and holds the piece together well in a subtle way. I definitely could get some more getting use to with for loops!

sketch

//Serina Liu
//Section C
//serinal@andrew.cmu.edu
//project-04, string art

function setup() {
    createCanvas(400, 300);
    background (176, 196, 222);
    
var x = 3;
var y = 250; 

    for (var i = 0; i < 400; i += 4) {
        stroke(256, 256, 256);
        strokeWeight(2);
        line (x-3, y*i-7, 30*i, 300); //left curve
        var y = x * 0.5; //every time the y value is used, it is multiplying x by 0.5 
        stroke (255, 255, 0,90); 
        strokeWeight (1);
        line (x, y*i-50, 300 *i , 30); //background yellow curve
        stroke (256, 256, 256);
        strokeWeight (2);
        line (399, 3*i, 5*i, 1); //upper right curve
        strokeWeight (0.6);
        line (0, y*i, 2*i, 1); //crosshatching line
        strokeWeight (2);
        line (1, 5*i+90, 5*i, 299); // lower left curve
        line (6*i, 300, 400, height-5*i) // lower right curve

    }
}

Project-04-chickoff

sketch

//Cora Hickoff
//Section D 
//chickoff@andrew.cmu.edu
//Project-04

function setup() {

    createCanvas(400, 300);
    background(240, 200, 200);

}

function draw() {

    //light blue strings
    stroke(180, 200, 220);
    strokeWeight(4);
    for (var x1 = 0; x1<=300; x1+=10) {
    curve(100, 100, 100+x1, 100+x1, 30+x1, 150, 200, 200);
}

    //red strings
    stroke(250, 80, 90);
    for (var y1 = 5; y1<=215; y1+=5) {
    curve (150, 15, 50+y1, 500+y1, 10+y1, 12, 50, 70);
}

    //bottom white strings
    stroke(255);
    for (var x2 = 30; x2<= 300; x2+=9) {
    curve (20, 20, 30+x2, 40+x2, 10-x2, 300, 40, 50);
}
    //pink lines
    stroke(220, 150, 189);
    for (var x2 = 30; x2<= 300; x2+=9) {
    line (0, 12+x2, 250+x2, 10+x2);
}

}

When I first started this project, I found that the thin lines and curves felt too harsh, so I added a line of code that made the stroke weight heavier and therefore make the drawing softer.

In addition, I realized that by deleting the code, “noFill();” the black in the drawing appeared and created a faded, 3D effect, which was interesting to have in a flat drawing.

Pictured below is what the drawing looks like when “noFill();” is added to the code.

gyueunp – Project-04: String Art

String Art

//GyuEun Park
//15-104 E
//gyueunp@andrew.cmu.edu
//Project-04

function setup() {
    createCanvas(400, 300);
    background(0);
}

function draw() {
	var x1 = -5;
	var y1 = -25;
	var x2;
	var y2;

	for (var x2 = 0; x2 < width; x2 += 10) {
		for (var y2 = 0; y2 < height; y2 += 10)
	stroke(255);
	strokeWeight(0.2);
//lines from top left 
	line(x1-15,y1,x2,y2,40);
	line(x1-25,y1,x2,y2,40);
	line(x1-35,y1,x2,y2,40);
//lines from top right 
	line(width+35,y1,x2,y2,40);
	line(width+25,y1,x2,y2,40);
	line(width+15,y1,x2,y2,40);
}

//growing center lines
	for (var i=0; i <= 2000; i += 100){
		var xPos = random(0,width); 
		var yPos = random(0,height);
		var x2Pos = random(width/2,width/2);
		var y2Pos = random(height/2,height/2);
		var linethickness = random(0,1);
	stroke(255,20);
    strokeWeight(linethickness);
    line(xPos,yPos,x2Pos,y2Pos);
}
}

One of the most attractive aspects of string art is the pattern that is created by the merging lines. Therefore, I focused on accentuating the patterns that are created by the spaces between the lines. In order to provide a contrast, I decided to limit the usage of colors for this project.

mstropka-Project-04

sketch

//Max Stropkay
//Section E
//mstropka@andrew.cmu.edu
//Project-04


function setup() {
    createCanvas(400, 300);

}
function draw() {
  background(255);
  //draw ten lines from upper left corner
  //line spacing controled by mouseX and mouseY
  for(var i = 0; i < 10; i ++){
    line(0, 0, i*mouseX, mouseY);
  }
  //draw ten lines from upper right
  for(var i = 0; i < 10; i ++){
    line(400, 300 , i*mouseX, mouseY);
  }
  //draw ten lines from lower right
  for(var i = 0; i < 10; i ++){
    line(400, 0, i*mouseX, mouseY);
  }
  //draw ten lines from lower right
  for(var i = 0; i < 10; i ++){
    line(0, 300 , i*mouseX, mouseY);
  }


}

For this project, I tried doing something simple because I am still not 100% comfortable with loops. So I made a couple loops that generate lines that touch at the x and y values of the mouse.

mjanco-Assignment-04-String-Art-Section-B

stringart

//Michelle Janco
//Section B
//mjanco@andrew.cmu.edu
//Project-04-String-Art

var x2 = 1;
var y1 = 1;
var y2 = 0;
var xInc = 300;
var yInc = 400;

function setup() {
    createCanvas(400, 300);
    background(249,214,86);
}

function draw() {
  for (var x1 = 0; x1 < width; x1 += 5) {
    var y1 = x1 * .50;
    stroke(250,150,0);
    //vertical lines
    line(x1, y1, x1-80, y2);
    //upper right curve
    line(x2*yInc, y1, x1, y2);
    //diagonal center lines
    line(x2-100, yInc-65, x1, y1);
    //center triangular form
    stroke(240,100,0);
    line(yInc+40, x2*xInc, x1, y1);
    //upper right smaller curve
    stroke(240,100,0);
    line(xInc+65, y1+40, x1+20, y2);
    //bottom left curve
    stroke(250,150,0);
    line(x1, xInc, x2, y1);
    //lower left smaller curve
    stroke(240,100,0);
    line(x1-10, xInc-60, x2+35, y1);
  }
}

I found this assignment quite difficult because I did not have a clear vision going into it. This result is primarily from trying different things and seeing what works. However, I did enjoy playing with the color scheme.

mmirho – Project 4 – Line Art

After constructing a loop template for myself, the rest of the process was simple figuring out how each end of the line moves: Left, right, up or down.

When it came to the curves inside the middle box, I had to change the structure a little, but it was still relatively the same.

It was interesting trying to find a balance between the number of loop iterations and the distance the lines move each iteration, it creates different densities.

sketch

function setup() {
  createCanvas(400, 300);
}

function draw() {
    background(200);

    //Top Left
    x1 = 0;
    y1 = height/2;
    //These two set up the location of the first coordinate
    //of the line

    x2 = 0;
    y2 = 0;
    //These two set up the second coordinate
    //And by setting the coordinates as variables, I can
    //manipulate them in the loop to move the line

    fill(0);

    for (loop = 0 ; loop < 12 ; loop += 1) {
        //This loop moves a simple variable loop
        //along a series of steps, and then the actual
        //changing line-effecting variables change
        //within the loop

        line(x1, y1, x2, y2);
        //The actual line, composed of variables

        x1 += 0;
        y1 -= height/20;
        //Controls the movement of the first coordinate

        x2 += width/20;
        y2 -= 0;
        //Controls the movement of the second

        //These coordinate movement controls vary depending
        //on the corner the curve is created in, because each
        //coordinate needs to move a different direction
    }
    noLoop();
    //Cuts off the loop

    //This formula is used over and over again
    //for all four outside curves and the two inside curves


    //Top Right
    x1 = width;
    y1 = height/2;
    x2 = width;
    y2 = 0;

    for (loop = 0 ; loop < 12 ; loop += 1) {
        line(x1, y1, x2, y2);
        x1 += 0;
        y1 -= height/20;
        x2 -= width/20;
        y2 -= 0;
    }
    noLoop();


    //Bottom Left
    x1 = 0;
    y1 = height/2;
    x2 = 0;
    y2 = height;

    for (loop = 0 ; loop < 12 ; loop += 1) {
        line(x1, y1, x2, y2);
        x1 += 0;
        y1 += height/20;
        x2 += width/20;
        y2 -= 0;
    }
    noLoop();


    //Bottom Right
    x1 = width;
    y1 = height/2;
    x2 = width;
    y2 = height;

    for (loop = 0 ; loop < 12 ; loop += 1) {
        line(x1, y1, x2, y2);
        x1 += 0;
        y1 += height/20;
        x2 -= width/20;
        y2 -= 0;
    }
    noLoop();
    
    rectMode(CENTER);
    rect(width/2, height/2, height/2, height/2);
    stroke(200);

    //Middle Box top left
    x1 = width/2 - height/4;
    y1 = 3*height/4;
    x2 = width/2 - height/4;
    y2 = height/4;

    for (loop = 0 ; loop < 21 ; loop += 1) {
        line(x1, y1, x2, y2);
        x1 += 0;
        y1 -= height/40;
        x2 += height/40;
        y2 -= 0;
    }
    noLoop();


    //Middle Box bottom right
    x1 = width/2 + height/4;
    y1 = height/4;
    x2 = width/2 + height/4;
    y2 = 3*height/4;

    for (loop = 0 ; loop < 21 ; loop += 1) {
        line(x1, y1, x2, y2);
        x1 += 0;
        y1 += height/40;
        x2 -= height/40;
        y2 -= 0;
    }
    noLoop();
    
    noStroke();
    fill(255,235,0);
    ellipse(width/2, height/2, height/7, height/7);
    //I tried to make a creepy-ish eye here
}

danakim-Project-04

sketch

//Dana Kim
//danakim@andrew.cmu.edu
//Section D
//Project-04

function setup() {
  createCanvas(400, 300);
  background(247, 196, 195);
}
function draw() {
  //midpoints of edge of canvas
  var x1 = width/2;
  var y1 = 0;
  var x2 = 0;
  var y2 = height/2;
  var x3 = width/2;
  var y3 = height;
  var x4 = width;
  var y4 = height/2;
  //outer corners
  var x5 = 0;
  var y5 = 0;
  var x6 = width;
  var y6 = 0;
  var x7 = width;
  var y7 = height;
  var x8 = 0;
  var y8 = height;

  stroke(0);
  strokeWeight(5);
  //midpoints of edges
  point(x1, y1);
  point(x2, y2);
  point(x3, y3);
  point(x4, y4);
  //outer corners
  point(x5, y5);
  point(x6, y6);
  point(x7, y7);
  point(x8, y8);

//midpoint of edge lines
  //lines from left midpoint of canvas to
  //points along the y-axis on top side of
  //canvas
  for(var i = 0; i <= 75; i+= 18.75){
    stroke(0);
    strokeWeight(1);
    line(0, height/2, width/2, i);
  }
  //lines from top midpoint of canvas to
  //points along the x-axis on left side of
  //canvas
  for(var i = 0; i <= 100; i+= 25){
    line(width/2, 0, i, height/2);
  }
  //lines from right midpoint of canvas to
  //points along the y-axis on top side of
  //canvas
  for(var i = 0; i <= 75; i+= 18.75){
    line(width, height/2, width/2, i);
  }
  //lines from top midpoint of canvas to
  //points along the x-axis on right side
  //of canvas
  for(var i = 400; i >= 300; i-= 25){
    line(width/2, 0, i, height/2);
  }
  //lines from left midpoint of canvas to
  //points along the y-axis on bottom side of
  //canvas
  for(var i = 300; i >= 225; i-= 18.75){
    line(0, height/2, width/2, i);
  }
  //lines from bottom midpoint of canvas to
  //points along the x-axis on left side of
  //canvas
  for(var i = 0; i <= 100; i+= 25){
    line(width/2, height, i, height/2);
  }
  //lines from right midpoint of canvas to
  //points along the y-axis on bottom side of
  //canvas
  for(var i = 225; i <= 300; i+= 18.75){
    line(width, height/2, width/2, i);
  }
  //lines from bottom midpoint of canvas to
  //points along the x-axis on right side
  //of canvas
  for(var i = 400; i >= 300; i-= 25){
    line(width/2, height, i, height/2);
  }

//outer corner lines
  //lines from top left corner to points
  // along top half of y-axis
  for(var i= 0; i <= 150; i += 18.75){
    stroke(0);
    strokeWeight(0.5);
    line(0, 0, width/2, i);
  }
  //lines from top left corner to points
  // along left half of x-axis
  for(var i= 0; i <= 200; i += 25){
    line(0, 0, i, height/2);
  }
  //lines from top right corner to points
  // along top half of y-axis
  for(var i= 0; i <= 150; i += 18.75){
    line(width, 0, width/2, i);
  }
  //lines from top right corner to points
  // along right half of x-axis
  for(var i= 200; i <= 400; i += 25){
    line(width, 0, i, height/2);
  }
  //lines from bottom left corner to points
  // along bottom half of y-axis
  for(var i= 150; i <= 300; i += 18.75){
    line(0, height, width/2, i);
  }
  //lines from bottom left corner to points
  // along right half of x-axis
  for(var i= 0; i <= 200; i += 25){
    line(0, height, i, height/2);
  }
  //lines from bottom right corner to points
  // along bottom half of y-axis
  for(var i= 150; i <= 300; i += 18.75){
    line(width, height, width/2, i);
  }
  //lines from top right corner to points
  // along right half of x-axis
  for(var i= 200; i <= 400; i += 25){
    line(width, height, i, height/2);
  }
}

This project was one of the easier ones we’ve had so far in my opinion. I used for() loops to generate the sets of lines. I kept it fairly simple by assigning the starting points to the corners of the canvas and to the midpoints of the edges of the canvas.

ashleyc1-Section C-Project-04-String-Art

sketch

//Ashley Chan
//Section C
//ashleyc1@andrew.cmu.edu
//Project-04-String-Art


var width = 400;
var height = 300;

var x1; //x of line
var y1; //y of line
var r; //rotational angle

function setup() {

    createCanvas(400, 300);

}

function draw() {
    background(249, 220, 187);

        x1 = 0; 
        y1 = 0;
        r = atan(height, width);

   for (var i = 0; i < 1000; i += 10) { 

        strokeWeight(.5);

        translate(width/2, height/2);
        rotate(r); //rotates lines so you can see it

        stroke(233, 100, 140); //pink
        line(x1 + 50, y1, 500, 1000); 
        line(x1, y1, 0, 500); 

        stroke(11, 47, 148); //navy
        line(x1, y1, -100, 500);

        stroke(0, 255, 252); //teal
        line(x1, y1, i + 200, 500); 
    }
}


Initially, I wanted to draw concentric circles for this project because the string art examples I found reminded me of spirographs and the fun “complex” circles children often make with a special tool. But after I made the image I wanted, for funsies, I continued altering my values and ended up with happier accidents. Below are some of the images I got along the way but this final image was the one that I personally responded to the most because of how different it was from the other iterations.


mjnewman Project-04, Section A

sketch

//Meredith Newman
//Section A
//mjnewman@andrew.cmu.edu
//Project-04-LineArt

function setup() {
    createCanvas(400, 300);
    background(135, 12, 3);
}

function draw() {
	//variables used to vary spacing inbetween lines
	//for lines going from the top of canvas to right
	var x1StepSize = 10;
	var y1StepSize = 15;

	//for lines going from the right of the canvas to the bottom
	var x2StepSize = 24;
	var y2StepSize = 16;

	//for lines going from the bottom to the left of the canvas
	var x3StepSize = 22;
	var y3StepSize = 12;

	//for lines going from the left to the top
	var x4StepSize = 11;
	var y4StepSize = 12;

	for (var spacing = 0; spacing < 30; spacing ++) {
		//as mouse moves across width of canvas, grayscale changes
		stroke(map(mouseX, 0, width, 0, 255));

		//equation for lines that go from top to right of canvas
		line(x1StepSize * spacing, 0, width, y1StepSize * spacing);

		//equation for lines that go from right to the bottom
		line(width, y2StepSize * spacing, (x1StepSize * -spacing) + width / 2, height);

		//equation for lines that go from bottom to the left
		line(x3StepSize * spacing, height, 0, y3StepSize * spacing);

		//equation for lines that go from left to the top
		line(0, (y4StepSize * spacing) + width / 2, (x4StepSize * -spacing) + width, 0);
	};
}

After creating three of the “curves,” my code started to remind me of the opening credits by Saul Bass for Vertigo. So, I tried to place the fourth set of lines so that the curve echoed the eye that is synonymous with the Vertigo opening sequence. In addition, I set the background a darker red that also echoes the opening sequence. The sequence is embedded below: